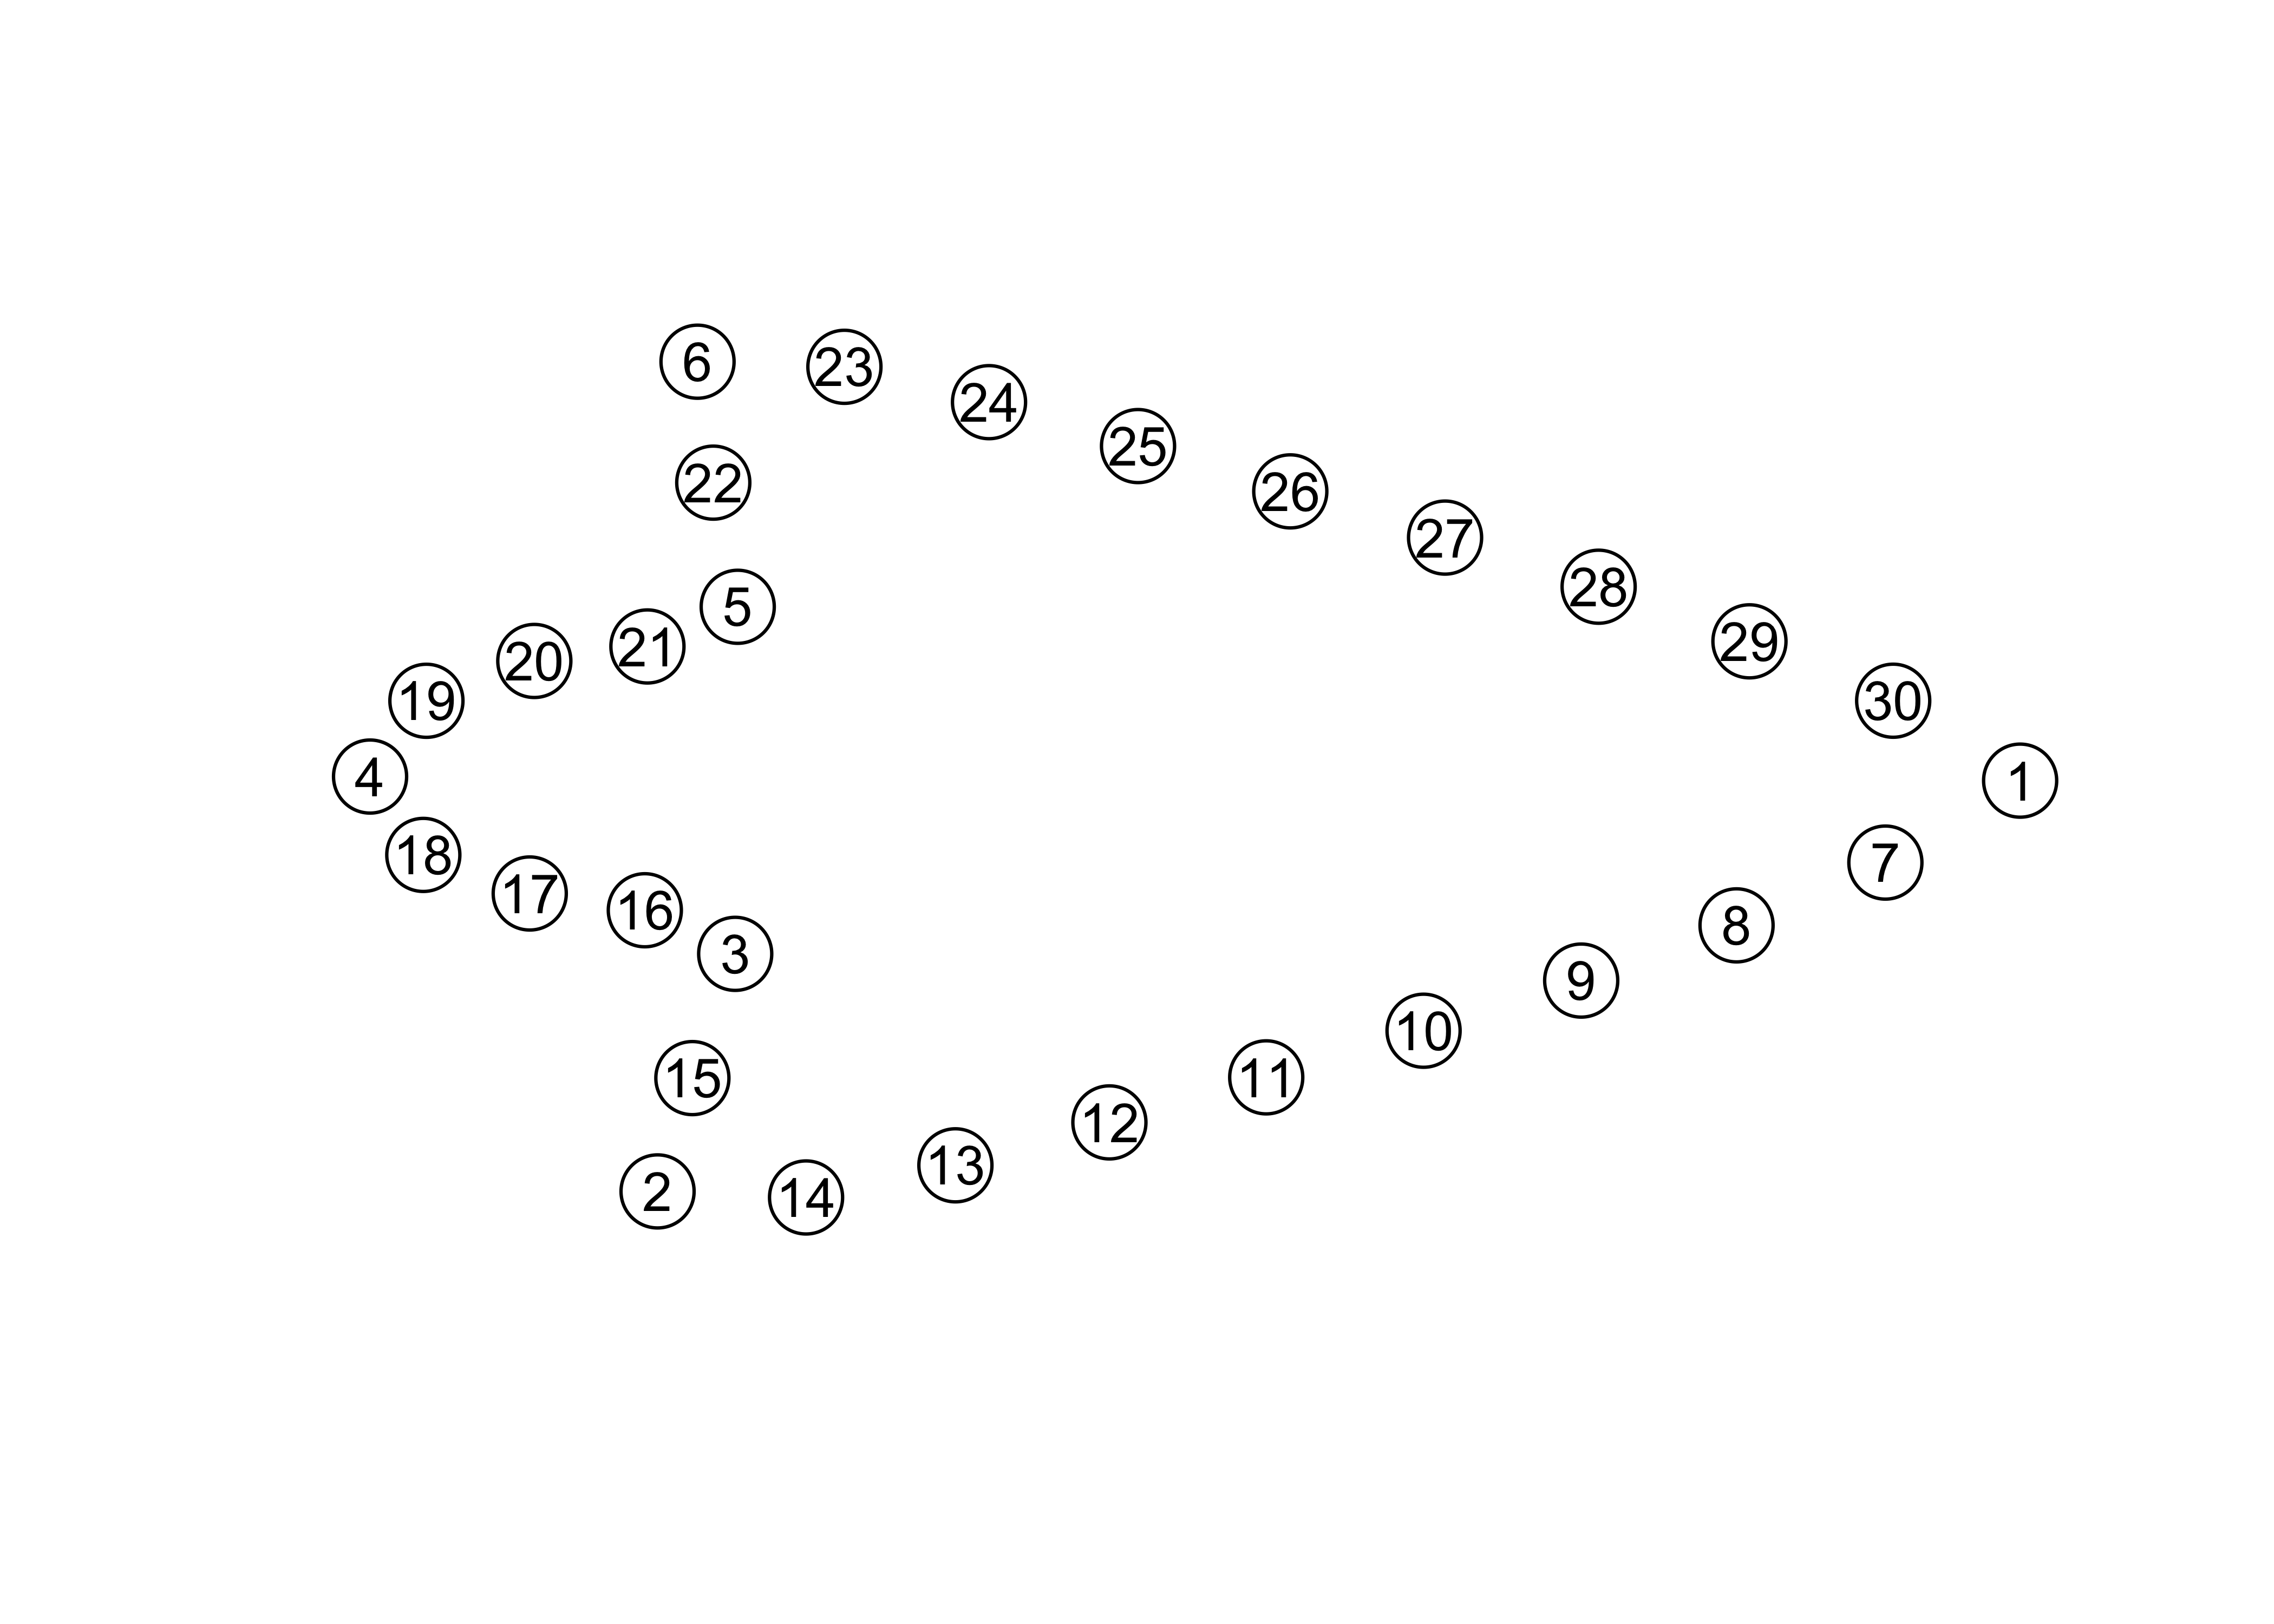
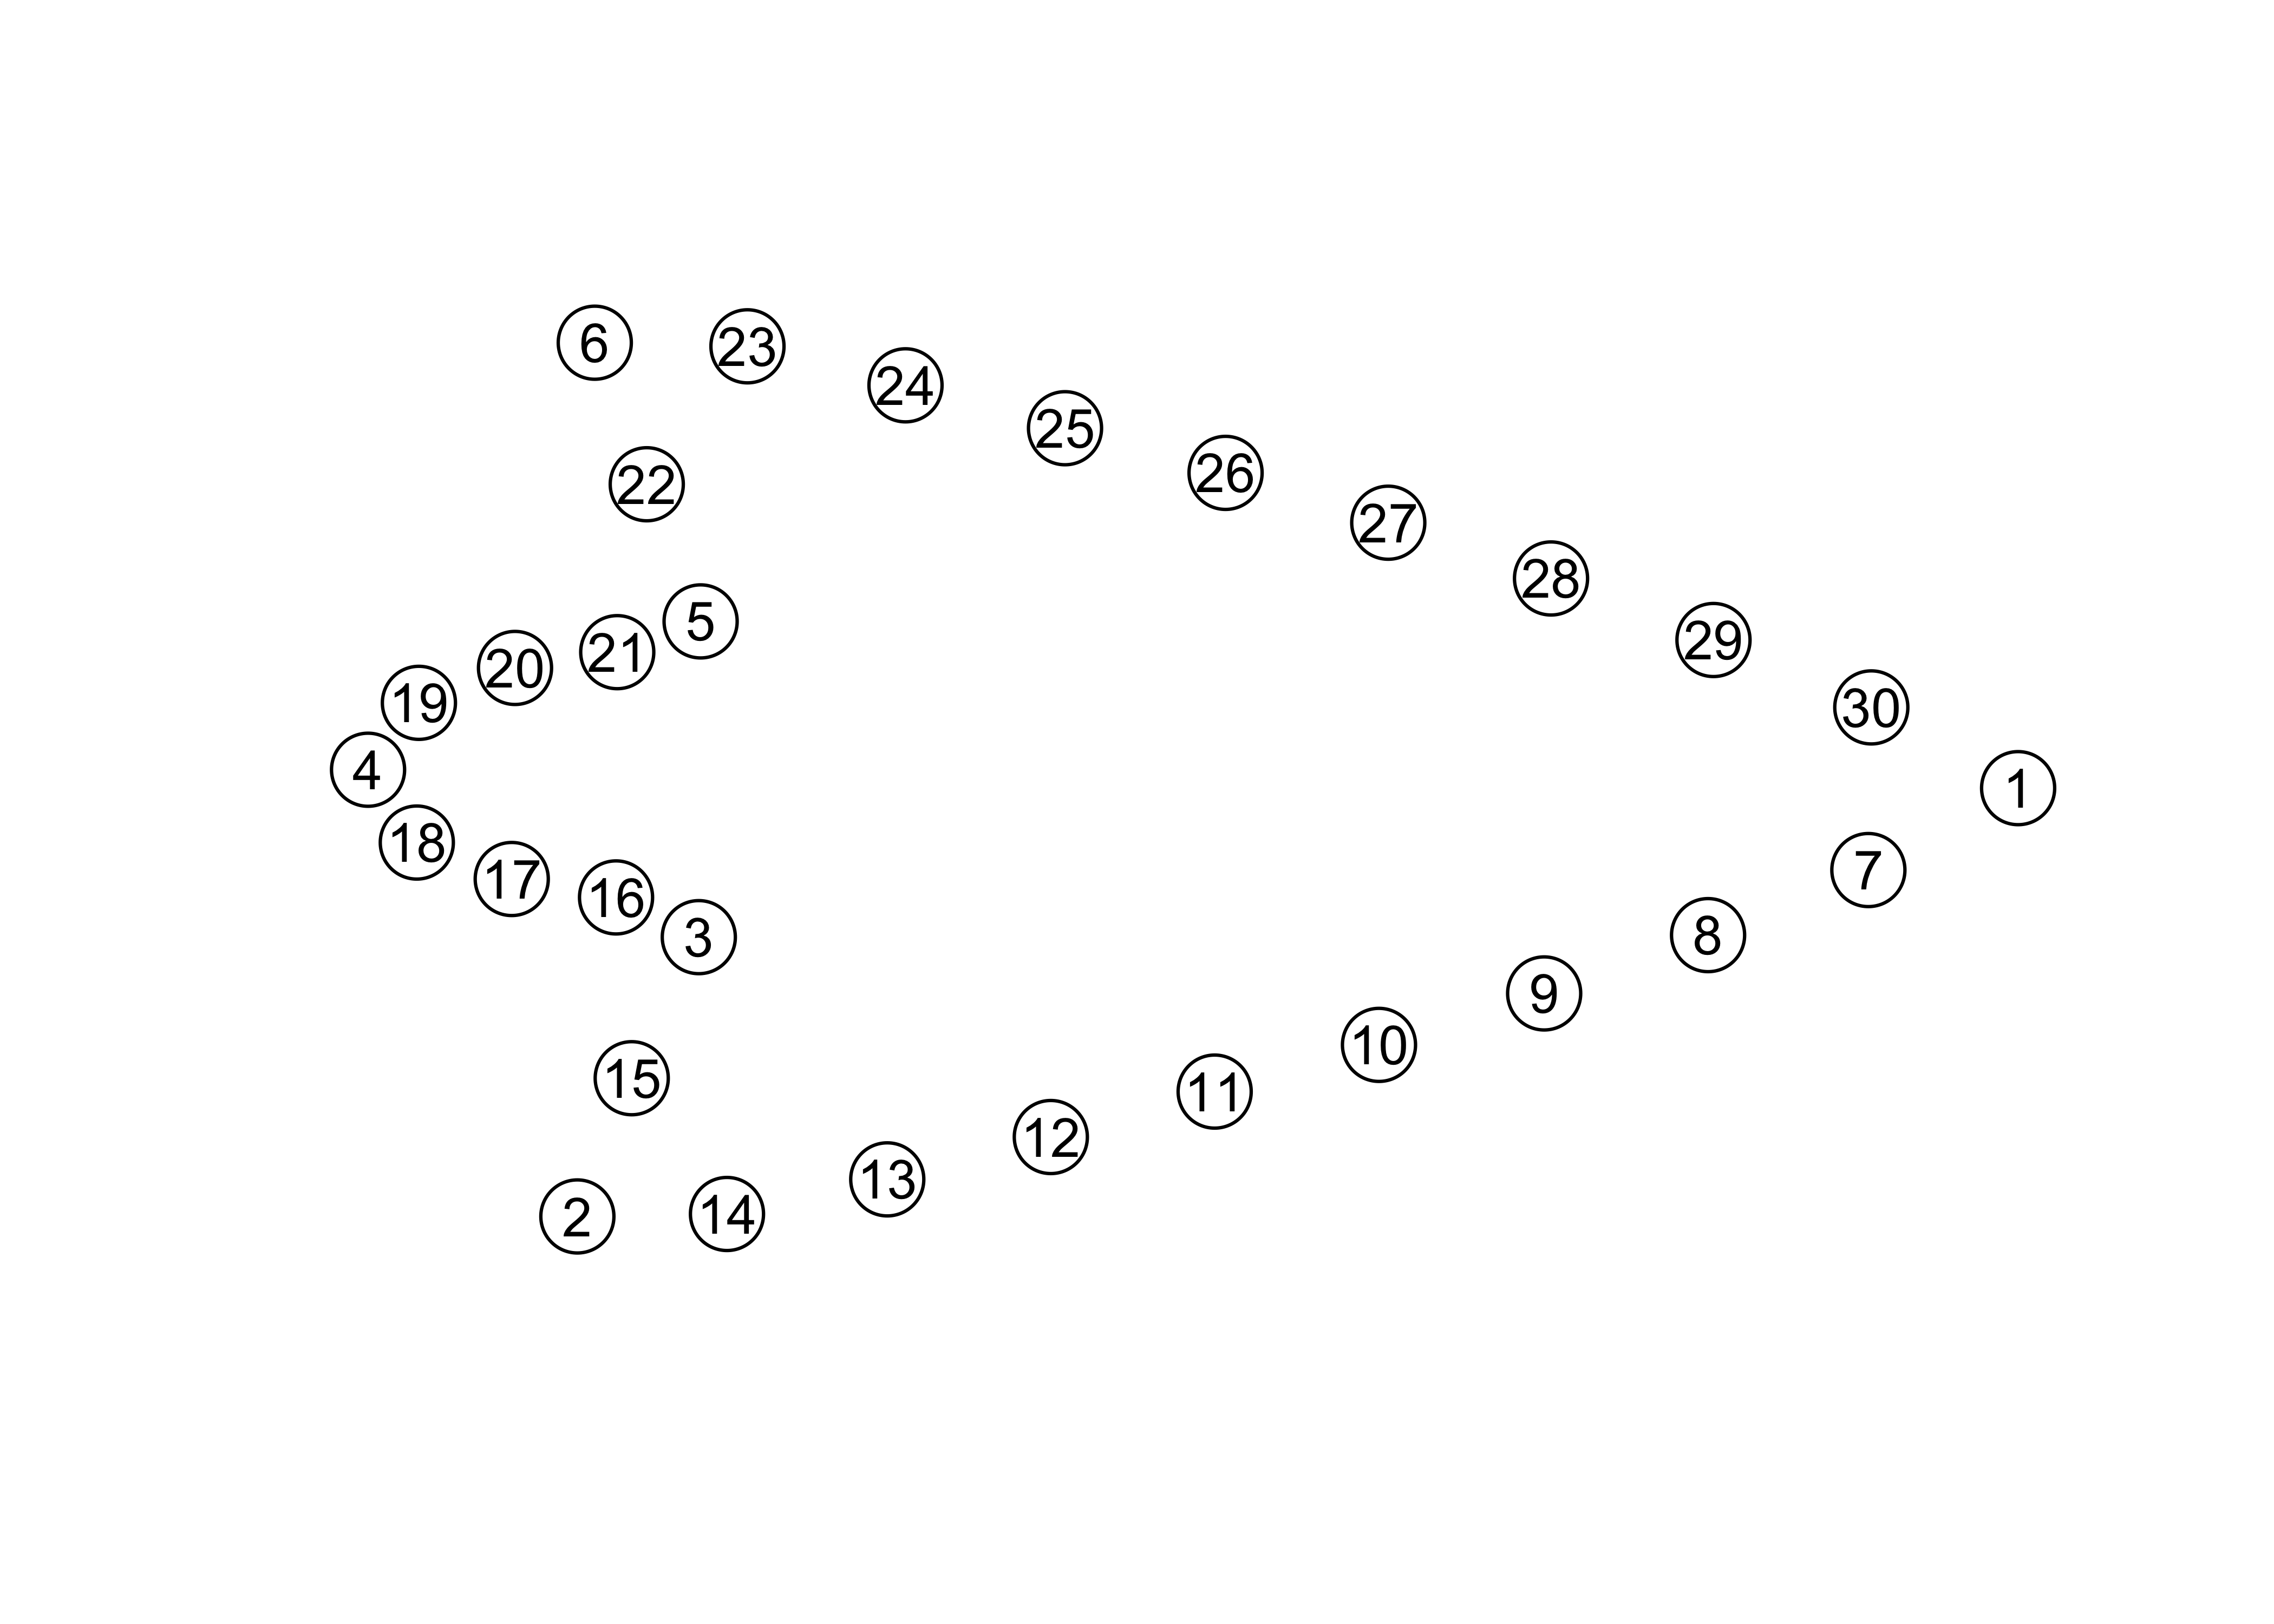
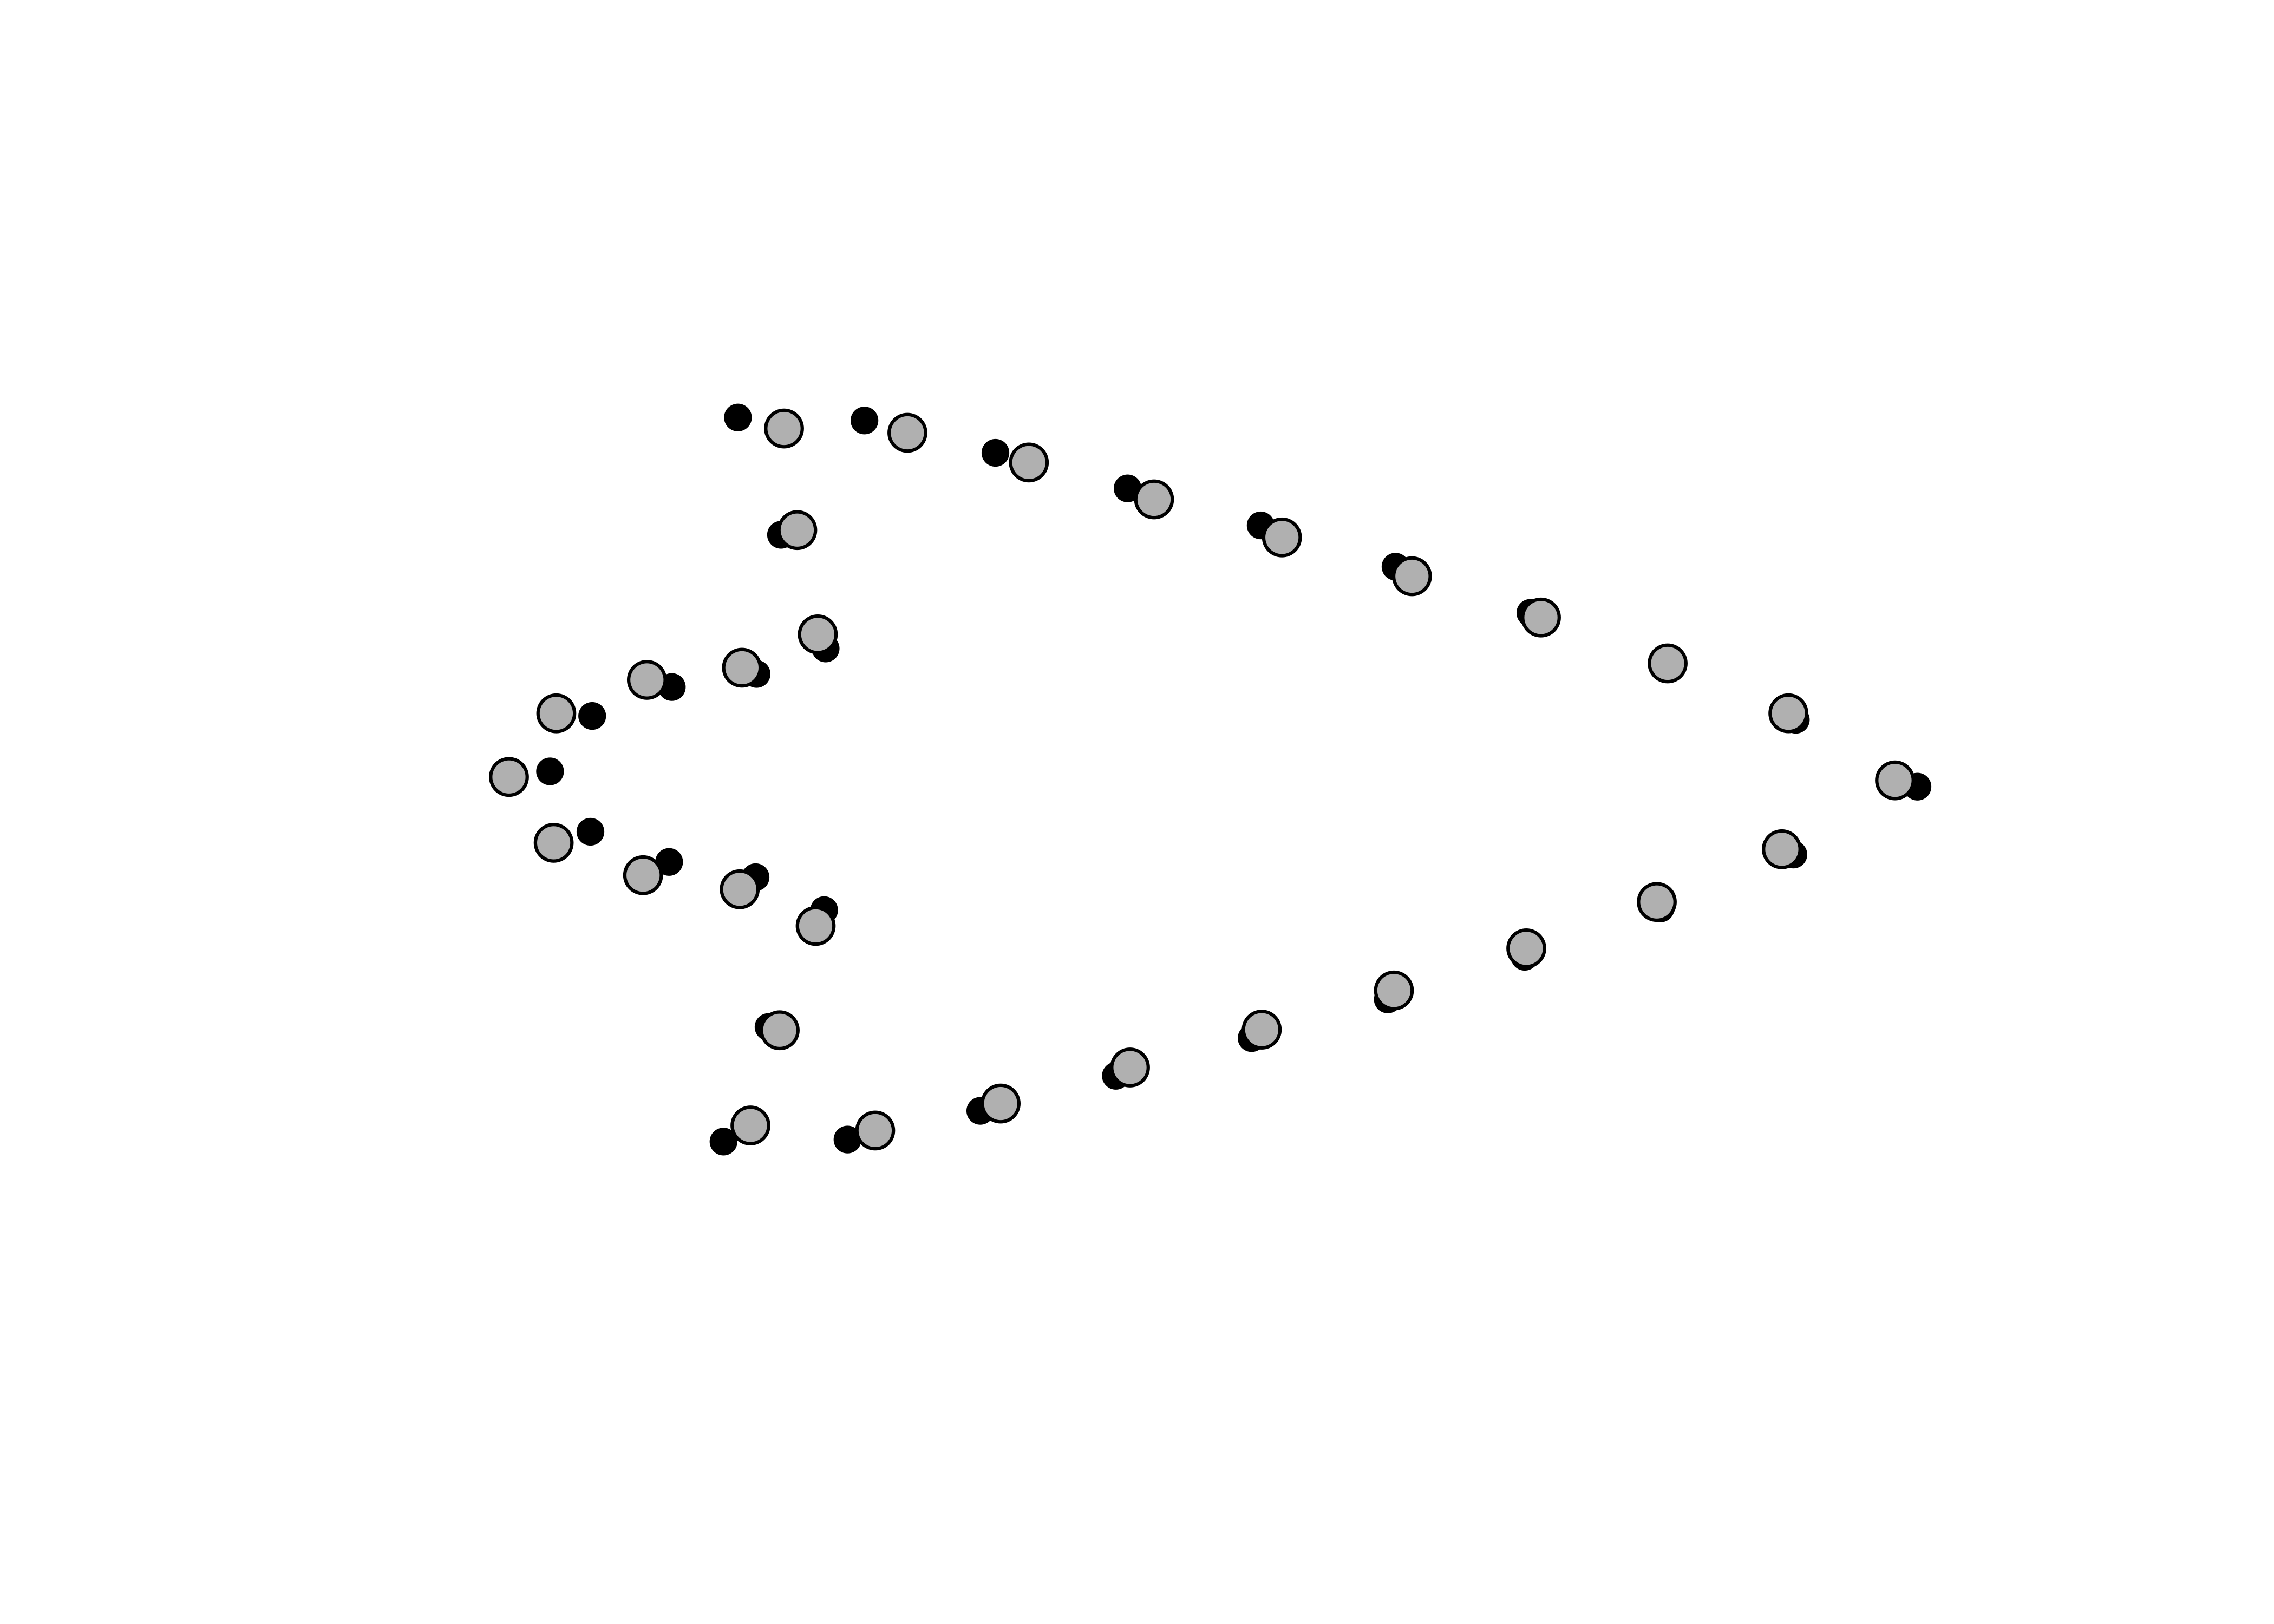
Geometric morphometrics

Load packages + data

# download most recent software version
#devtools::install_github("geomorphR/geomorph", ref = "Stable", build_vignettes = TRUE)
#devtools::install_github("mlcollyer/RRPP")

# load analysis packages
library(here)
here() starts at /Users/seldenjrz/Documents/github/perdiz3/supp
library(StereoMorph)
library(geomorph)
Loading required package: RRPP
Loading required package: rgl
Loading required package: Matrix
library(ggplot2)
library(dplyr)

Attaching package: 'dplyr'
The following objects are masked from 'package:stats':

    filter, lag
The following objects are masked from 'package:base':

    intersect, setdiff, setequal, union
library(ggpubr)
library(wesanderson)

# read shape data and define number of sLMs
shapes <- readShapes("shapes")
shapesGM <- readland.shapes(shapes, nCurvePts = c(10,3,5,5,3,10))

# read qualitative data
qdata <- read.csv("qdata.csv",
                  header = TRUE,
                  row.names = 1)
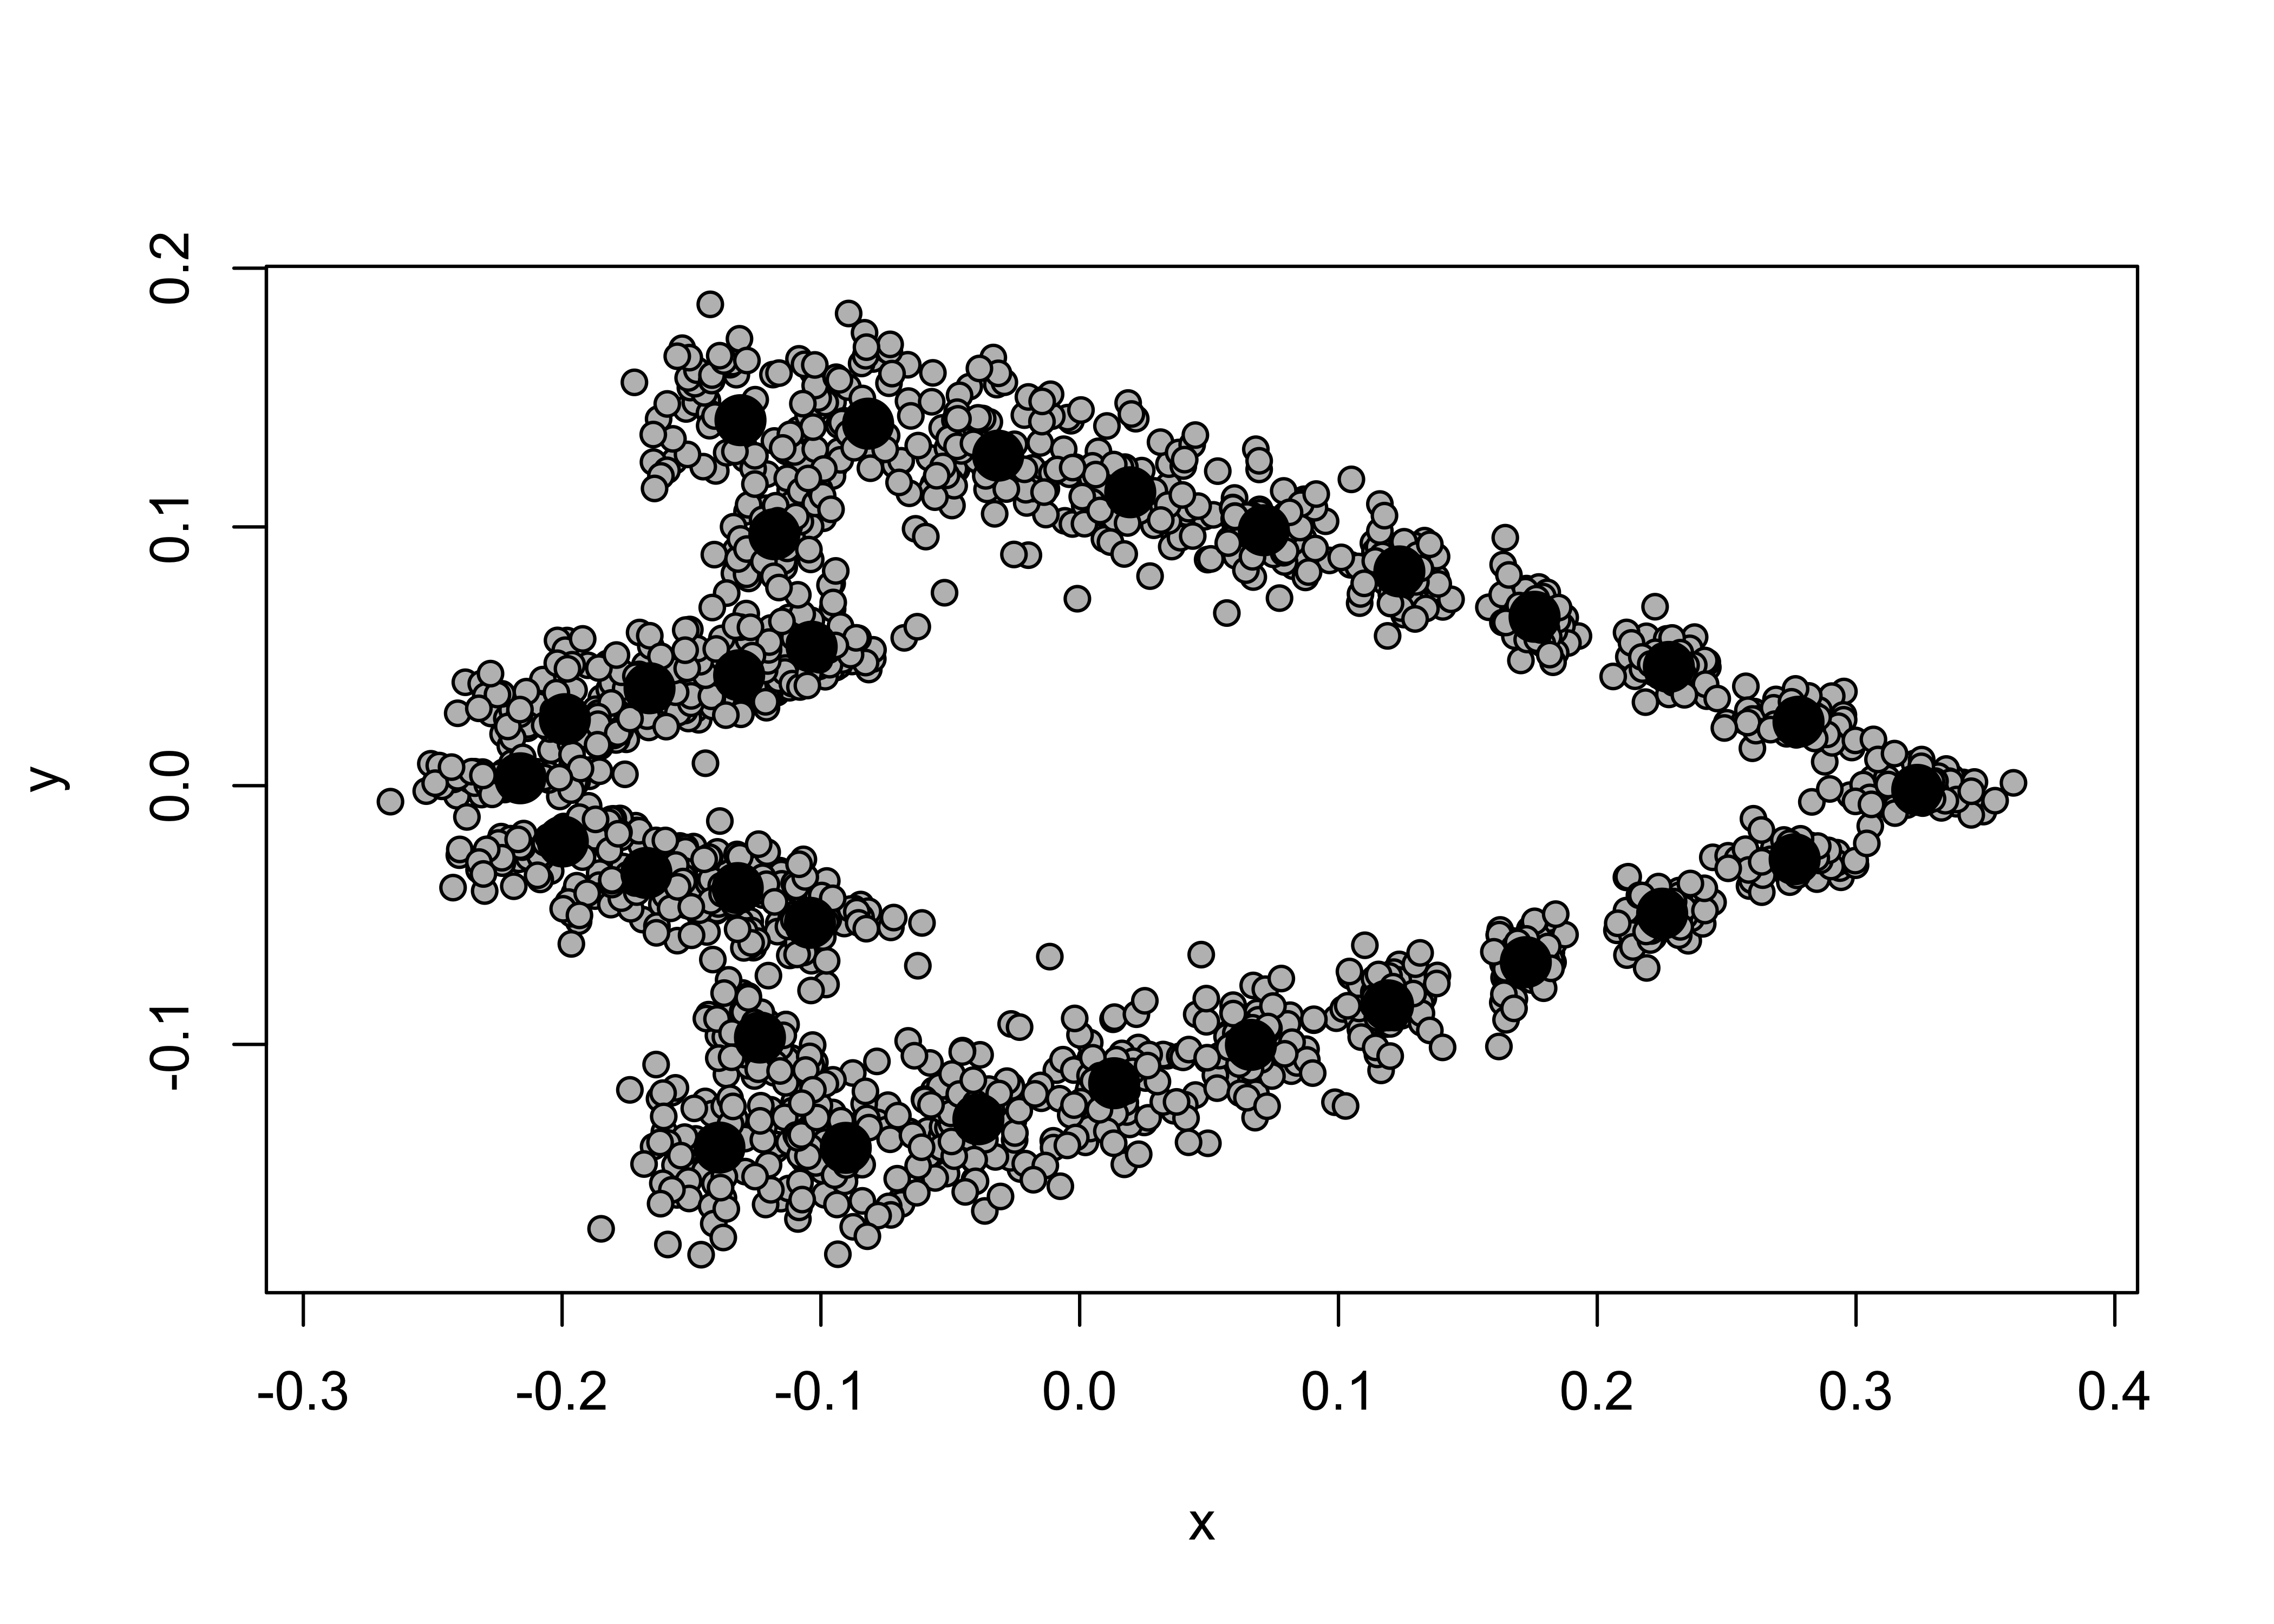
Generalised Procrustes Analysis

# gpa
Y.gpa <- gpagen(shapesGM, print.progress = FALSE)

## plot
plot(Y.gpa)

# dataframe
gdf <- geomorph.data.frame(shape = Y.gpa$coords,
                           size = Y.gpa$Csize,
                           region = qdata$region)

# add centroid size to qdata
qdata$csz <- Y.gpa$Csize

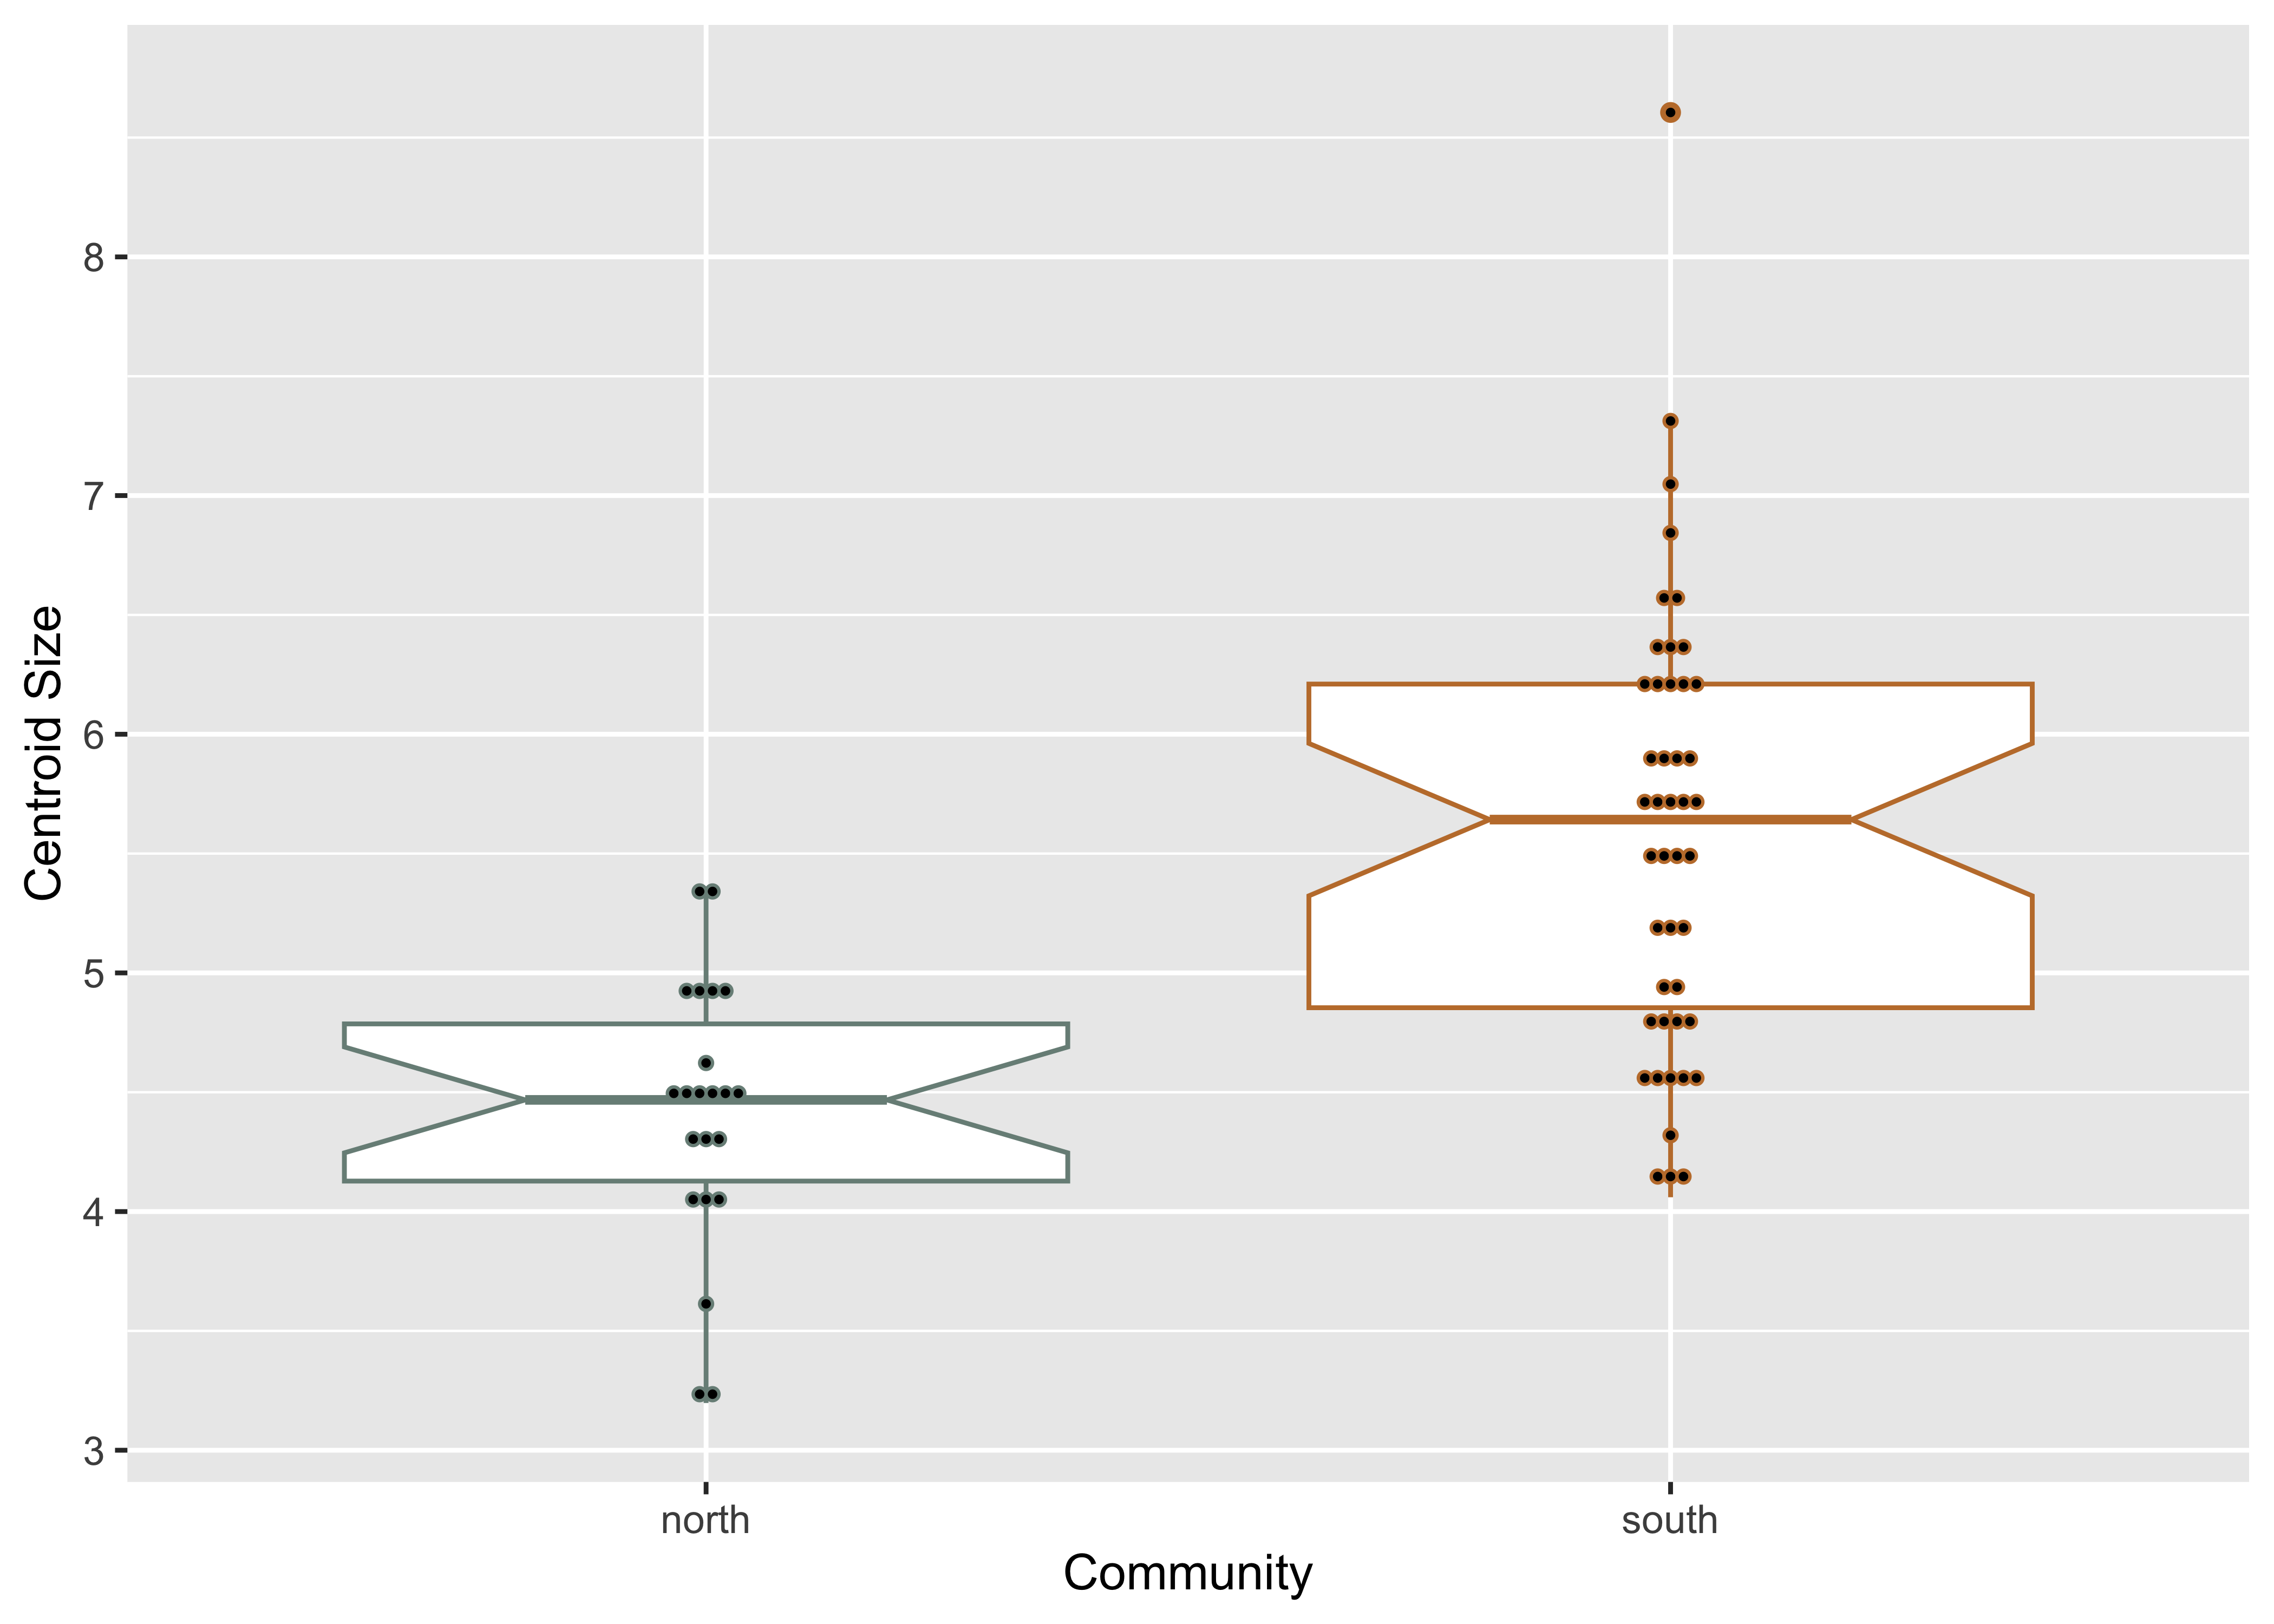
Boxplot (centroid size)

# attributes
csz <- qdata$csz
region <- qdata$region

# palette
pal = wes_palette("Moonrise2")

# boxplot of Perdiz arrow points by region
ggplot(qdata, aes(x = region, y = csz, color = region)) +
  geom_boxplot(notch = TRUE) +
  geom_dotplot(binaxis = 'y', stackdir = 'center', dotsize = 0.3) +
  scale_color_manual(values = pal) +
  theme(legend.position = "none") +
  labs(x = 'Community', y = 'Centroid Size')
Bin width defaults to 1/30 of the range of the data. Pick better value with
`binwidth`.

Principal Components Analysis

# pca
pca <- gm.prcomp(Y.gpa$coords)
summary(pca)

Ordination type: Principal Component Analysis 
Centering by OLS mean
Orthogonal projection of OLS residuals
Number of observations: 67 
Number of vectors 58 

Importance of Components:
                             Comp1       Comp2      Comp3        Comp4
Eigenvalues            0.005773408 0.004263677 0.00110953 0.0002718422
Proportion of Variance 0.475367265 0.351059970 0.09135581 0.0223827748
Cumulative Proportion  0.475367265 0.826427234 0.91778304 0.9401658161
                              Comp5        Comp6        Comp7        Comp8
Eigenvalues            0.0002235284 0.0001238687 9.341316e-05 5.630102e-05
Proportion of Variance 0.0184047395 0.0101990267 7.691394e-03 4.635678e-03
Cumulative Proportion  0.9585705557 0.9687695824 9.764610e-01 9.810967e-01
                              Comp9       Comp10       Comp11       Comp12
Eigenvalues            3.794795e-05 3.555976e-05 3.274869e-05 2.100995e-05
Proportion of Variance 3.124534e-03 2.927897e-03 2.696441e-03 1.729904e-03
Cumulative Proportion  9.842212e-01 9.871491e-01 9.898455e-01 9.915754e-01
                             Comp13       Comp14       Comp15       Comp16
Eigenvalues            1.673629e-05 1.558522e-05 0.0000146522 9.479467e-06
Proportion of Variance 1.378022e-03 1.283246e-03 0.0012064237 7.805144e-04
Cumulative Proportion  9.929535e-01 9.942367e-01 0.9954431225 9.962236e-01
                             Comp17       Comp18       Comp19       Comp20
Eigenvalues            8.202708e-06 6.581542e-06 5.623302e-06 4.551824e-06
Proportion of Variance 6.753894e-04 5.419068e-04 4.630079e-04 3.747852e-04
Cumulative Proportion  9.968990e-01 9.974409e-01 9.979039e-01 9.982787e-01
                             Comp21       Comp22       Comp23       Comp24
Eigenvalues            4.004696e-06 2.780295e-06 2.539899e-06 2.053898e-06
Proportion of Variance 3.297361e-04 2.289221e-04 2.091286e-04 1.691126e-04
Cumulative Proportion  9.986085e-01 9.988374e-01 9.990465e-01 9.992156e-01
                             Comp25       Comp26       Comp27       Comp28
Eigenvalues            1.684806e-06 1.383734e-06 1.008708e-06 9.296041e-07
Proportion of Variance 1.387225e-04 1.139330e-04 8.305433e-05 7.654116e-05
Cumulative Proportion  9.993543e-01 9.994683e-01 9.995513e-01 9.996279e-01
                             Comp29       Comp30       Comp31       Comp32
Eigenvalues            7.104462e-07 6.995574e-07 5.611282e-07 4.574896e-07
Proportion of Variance 5.849627e-05 5.759972e-05 4.620182e-05 3.766849e-05
Cumulative Proportion  9.996864e-01 9.997440e-01 9.997902e-01 9.998278e-01
                             Comp33       Comp34       Comp35       Comp36
Eigenvalues            3.740460e-07 3.295267e-07 3.023244e-07 2.819142e-07
Proportion of Variance 3.079797e-05 2.713236e-05 2.489260e-05 2.321208e-05
Cumulative Proportion  9.998586e-01 9.998858e-01 9.999107e-01 9.999339e-01
                             Comp37       Comp38       Comp39       Comp40
Eigenvalues            1.822967e-07 1.544787e-07 1.175824e-07 1.003652e-07
Proportion of Variance 1.500983e-05 1.271937e-05 9.681424e-06 8.263810e-06
Cumulative Proportion  9.999489e-01 9.999616e-01 9.999713e-01 9.999796e-01
                             Comp41       Comp42       Comp43       Comp44
Eigenvalues            8.345271e-08 3.996616e-08 3.159475e-08 2.666575e-08
Proportion of Variance 6.871277e-06 3.290708e-06 2.601429e-06 2.195587e-06
Cumulative Proportion  9.999864e-01 9.999897e-01 9.999923e-01 9.999945e-01
                             Comp45       Comp46       Comp47       Comp48
Eigenvalues            2.255638e-08 1.462538e-08 8.448002e-09 6.927099e-09
Proportion of Variance 1.857233e-06 1.204216e-06 6.955863e-07 5.703591e-07
Cumulative Proportion  9.999964e-01 9.999976e-01 9.999983e-01 9.999988e-01
                             Comp49       Comp50       Comp51       Comp52
Eigenvalues            3.723904e-09 3.152719e-09 2.374219e-09 1.963601e-09
Proportion of Variance 3.066164e-07 2.595866e-07 1.954869e-07 1.616777e-07
Cumulative Proportion  9.999991e-01 9.999994e-01 9.999996e-01 9.999998e-01
                             Comp53       Comp54       Comp55       Comp56
Eigenvalues            1.208301e-09 6.656422e-10 4.846033e-10 2.571792e-10
Proportion of Variance 9.948832e-08 5.480723e-08 3.990096e-08 2.117546e-08
Cumulative Proportion  9.999999e-01 9.999999e-01 1.000000e+00 1.000000e+00
                             Comp57       Comp58
Eigenvalues            1.910708e-10 8.289472e-11
Proportion of Variance 1.573227e-08 6.825333e-09
Cumulative Proportion  1.000000e+00 1.000000e+00
# set plot parameters
pch.gps <- c(15,17)[as.factor(region)]
col.gps <- pal[as.factor(region)]
col.hull <- c("#798E87", "#C27D38")

## pca plot
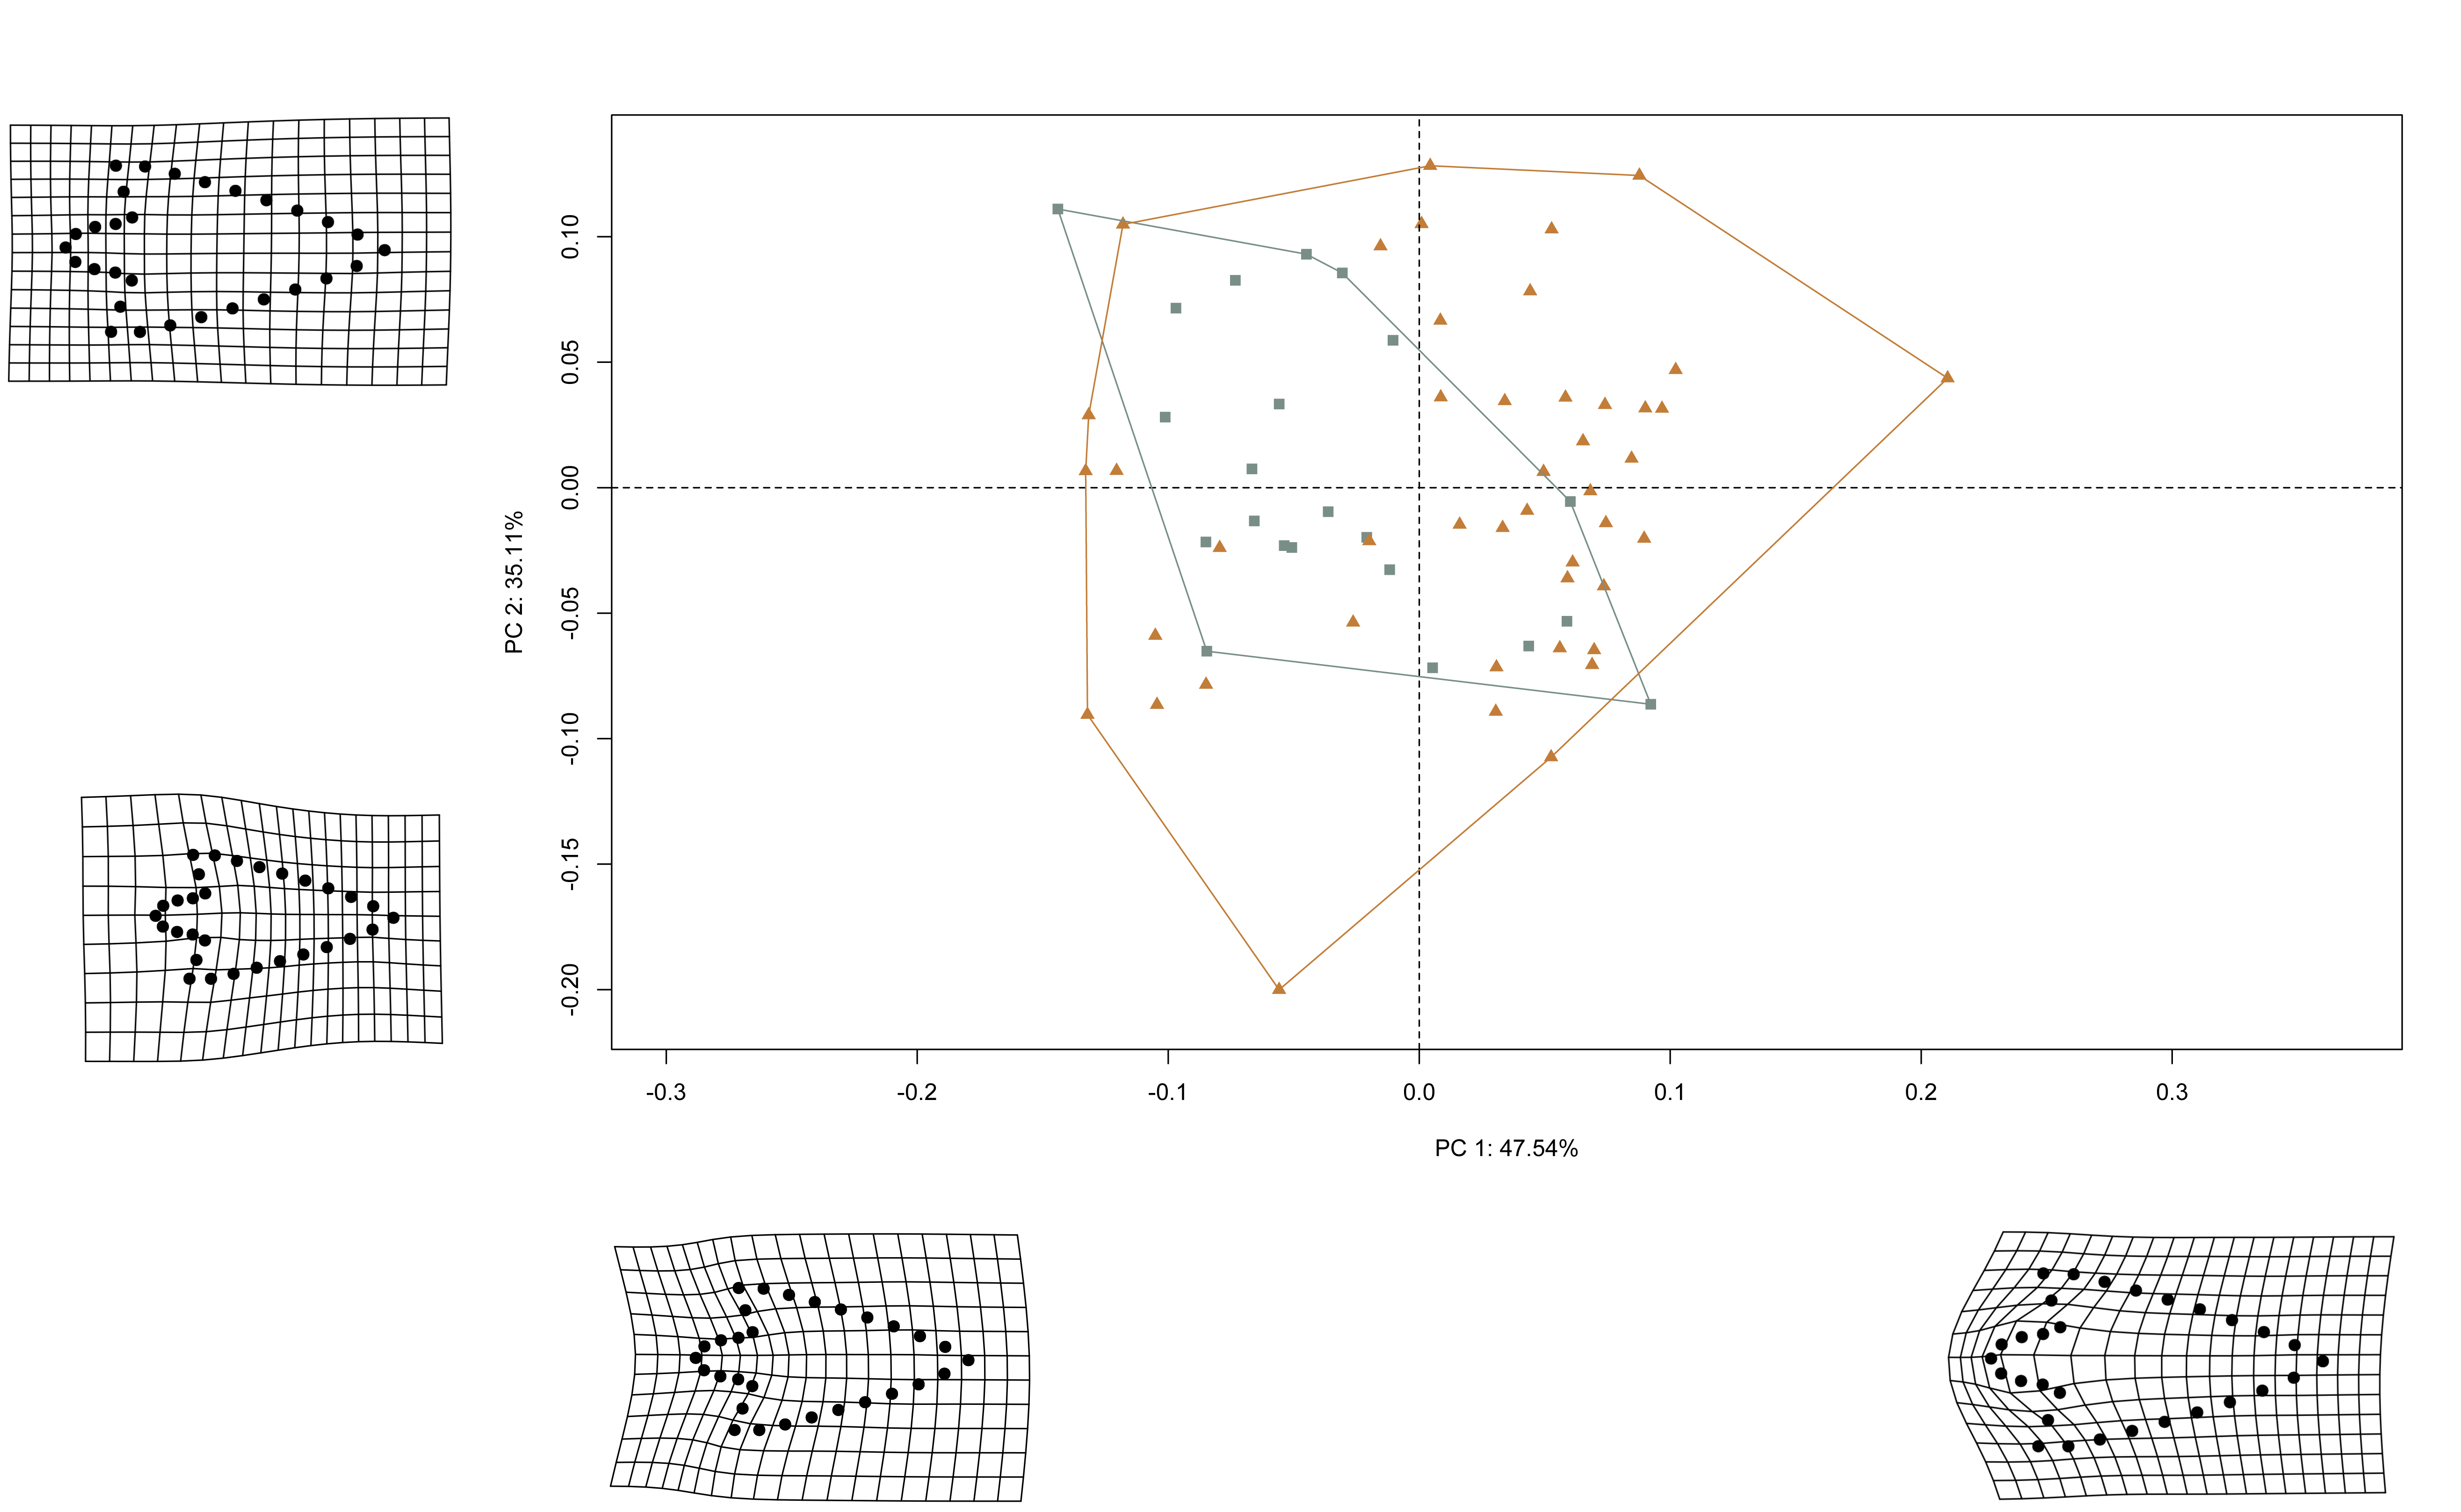
pc.plot <- plot(pca,
                asp = 1,
                pch = pch.gps,
                col = col.gps)
shapeHulls(pc.plot,
           groups = region,
           group.cols = col.hull)

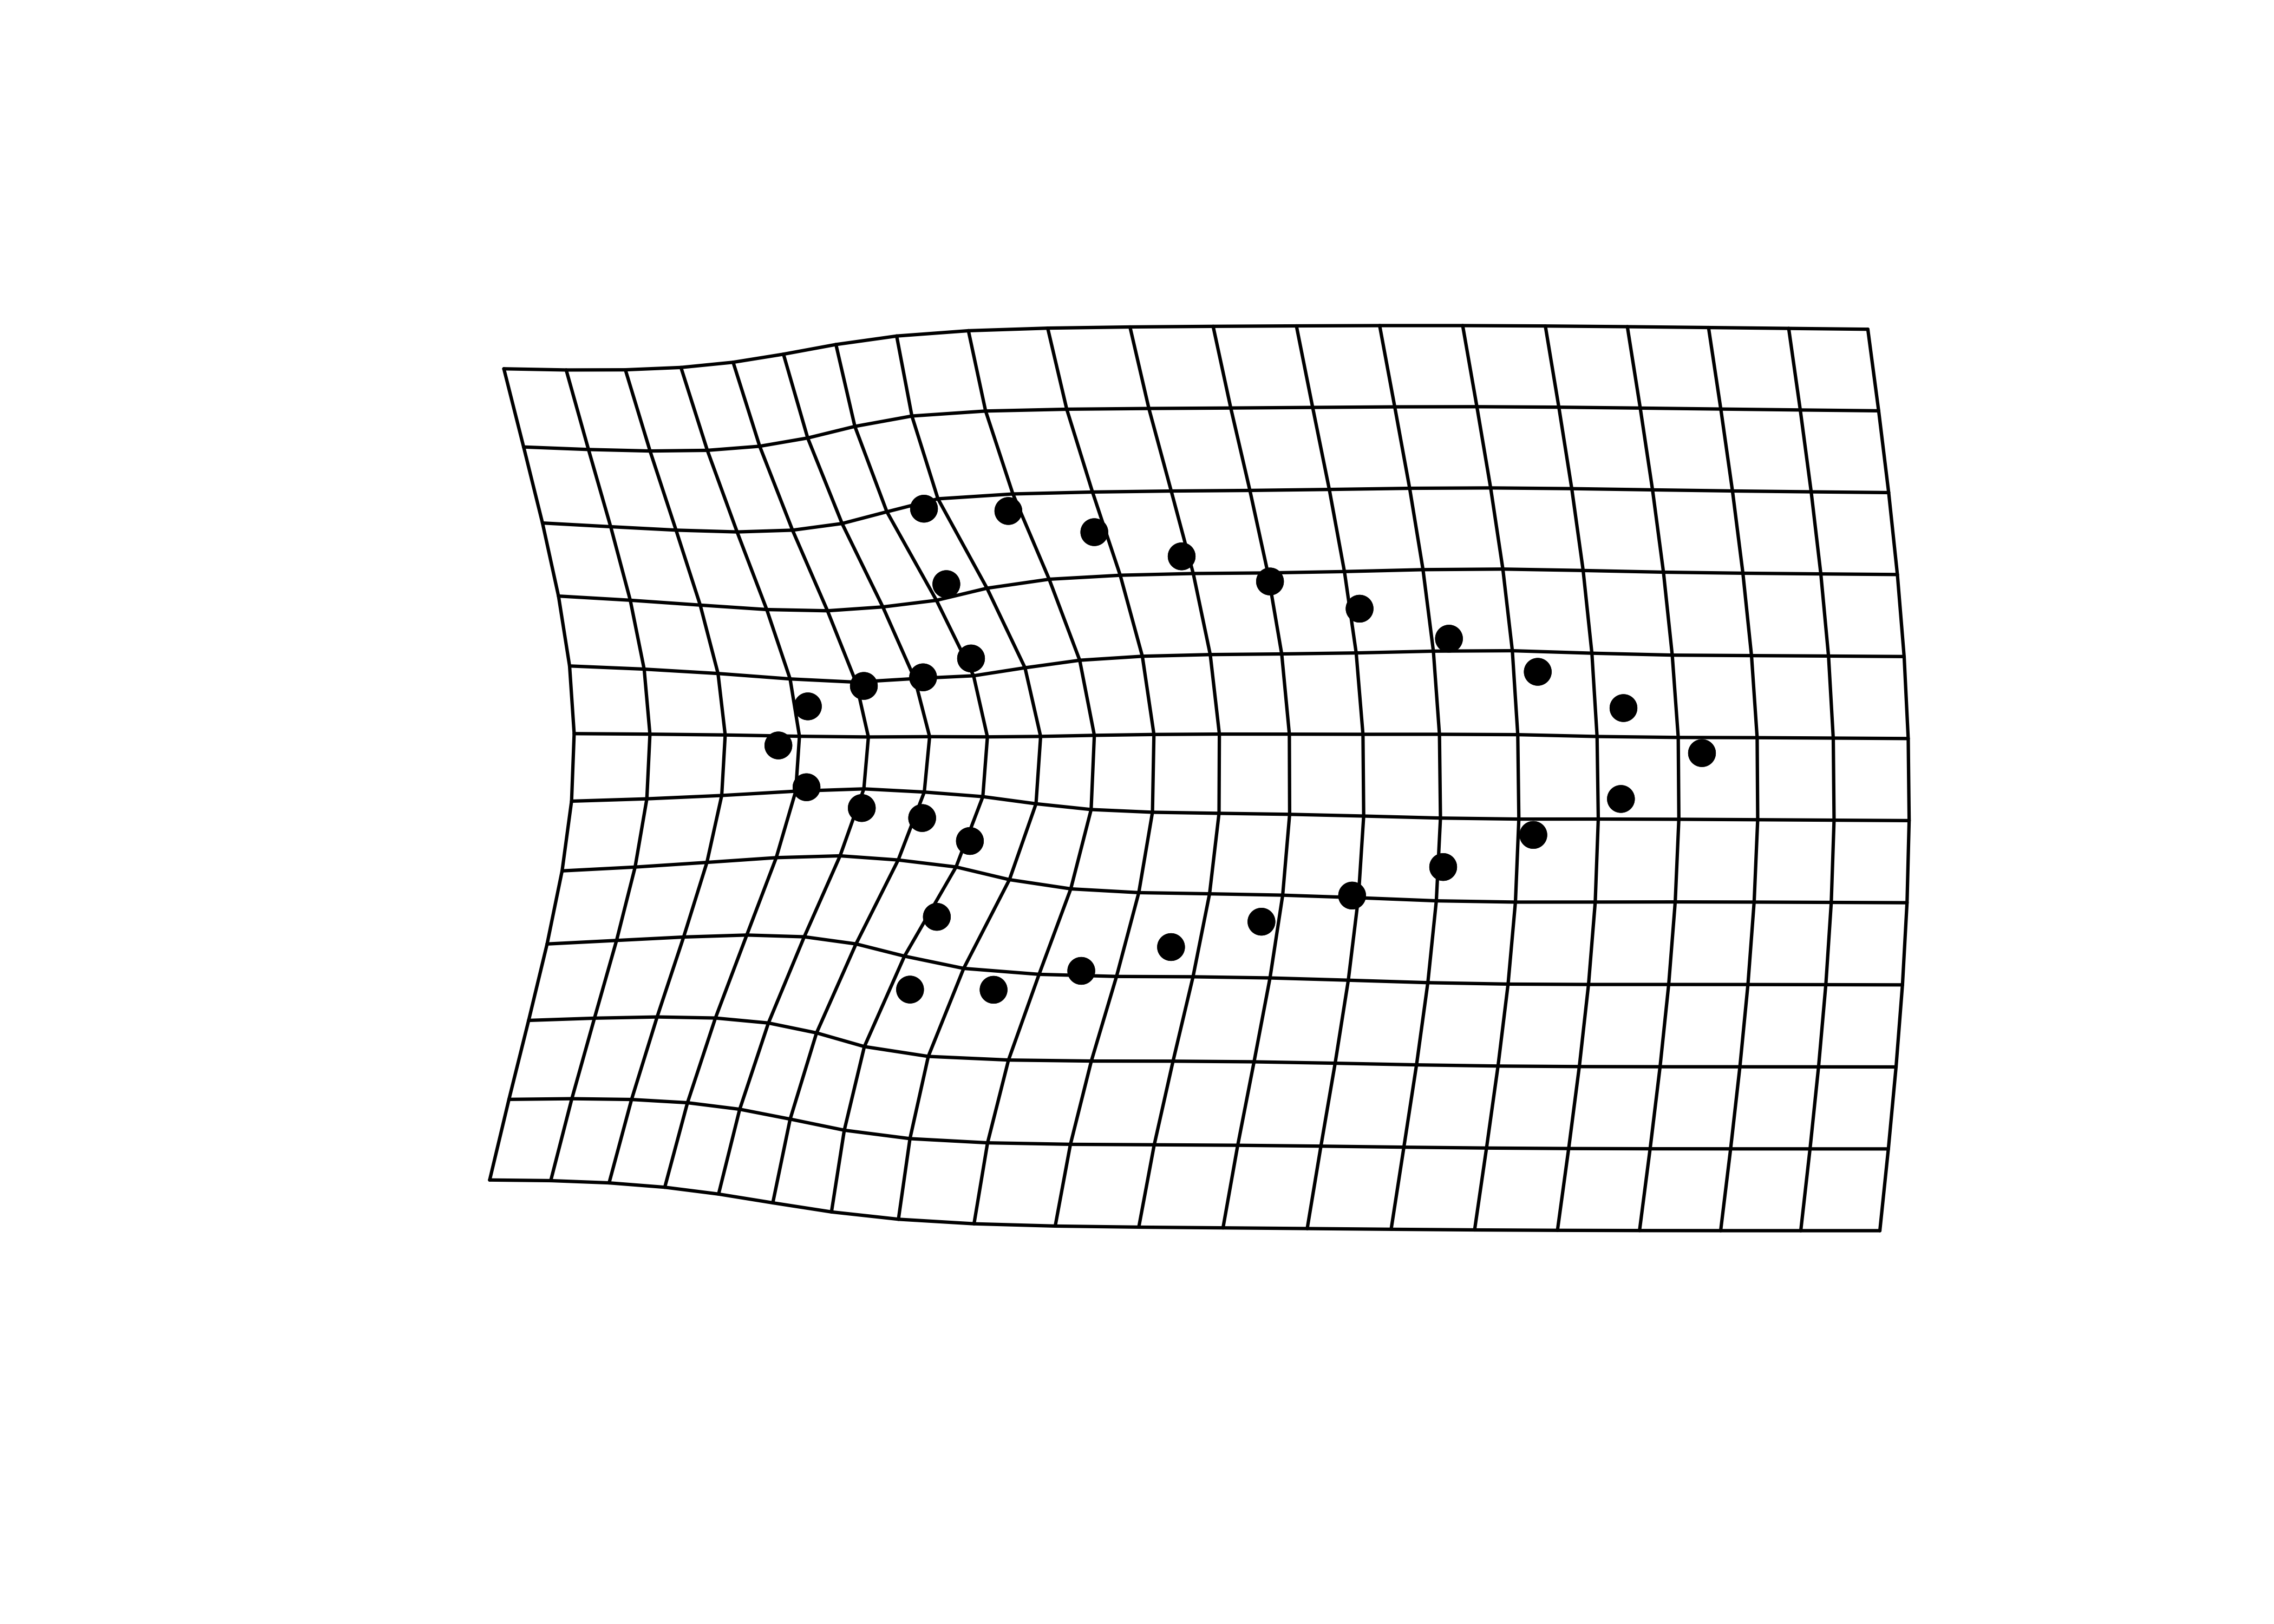
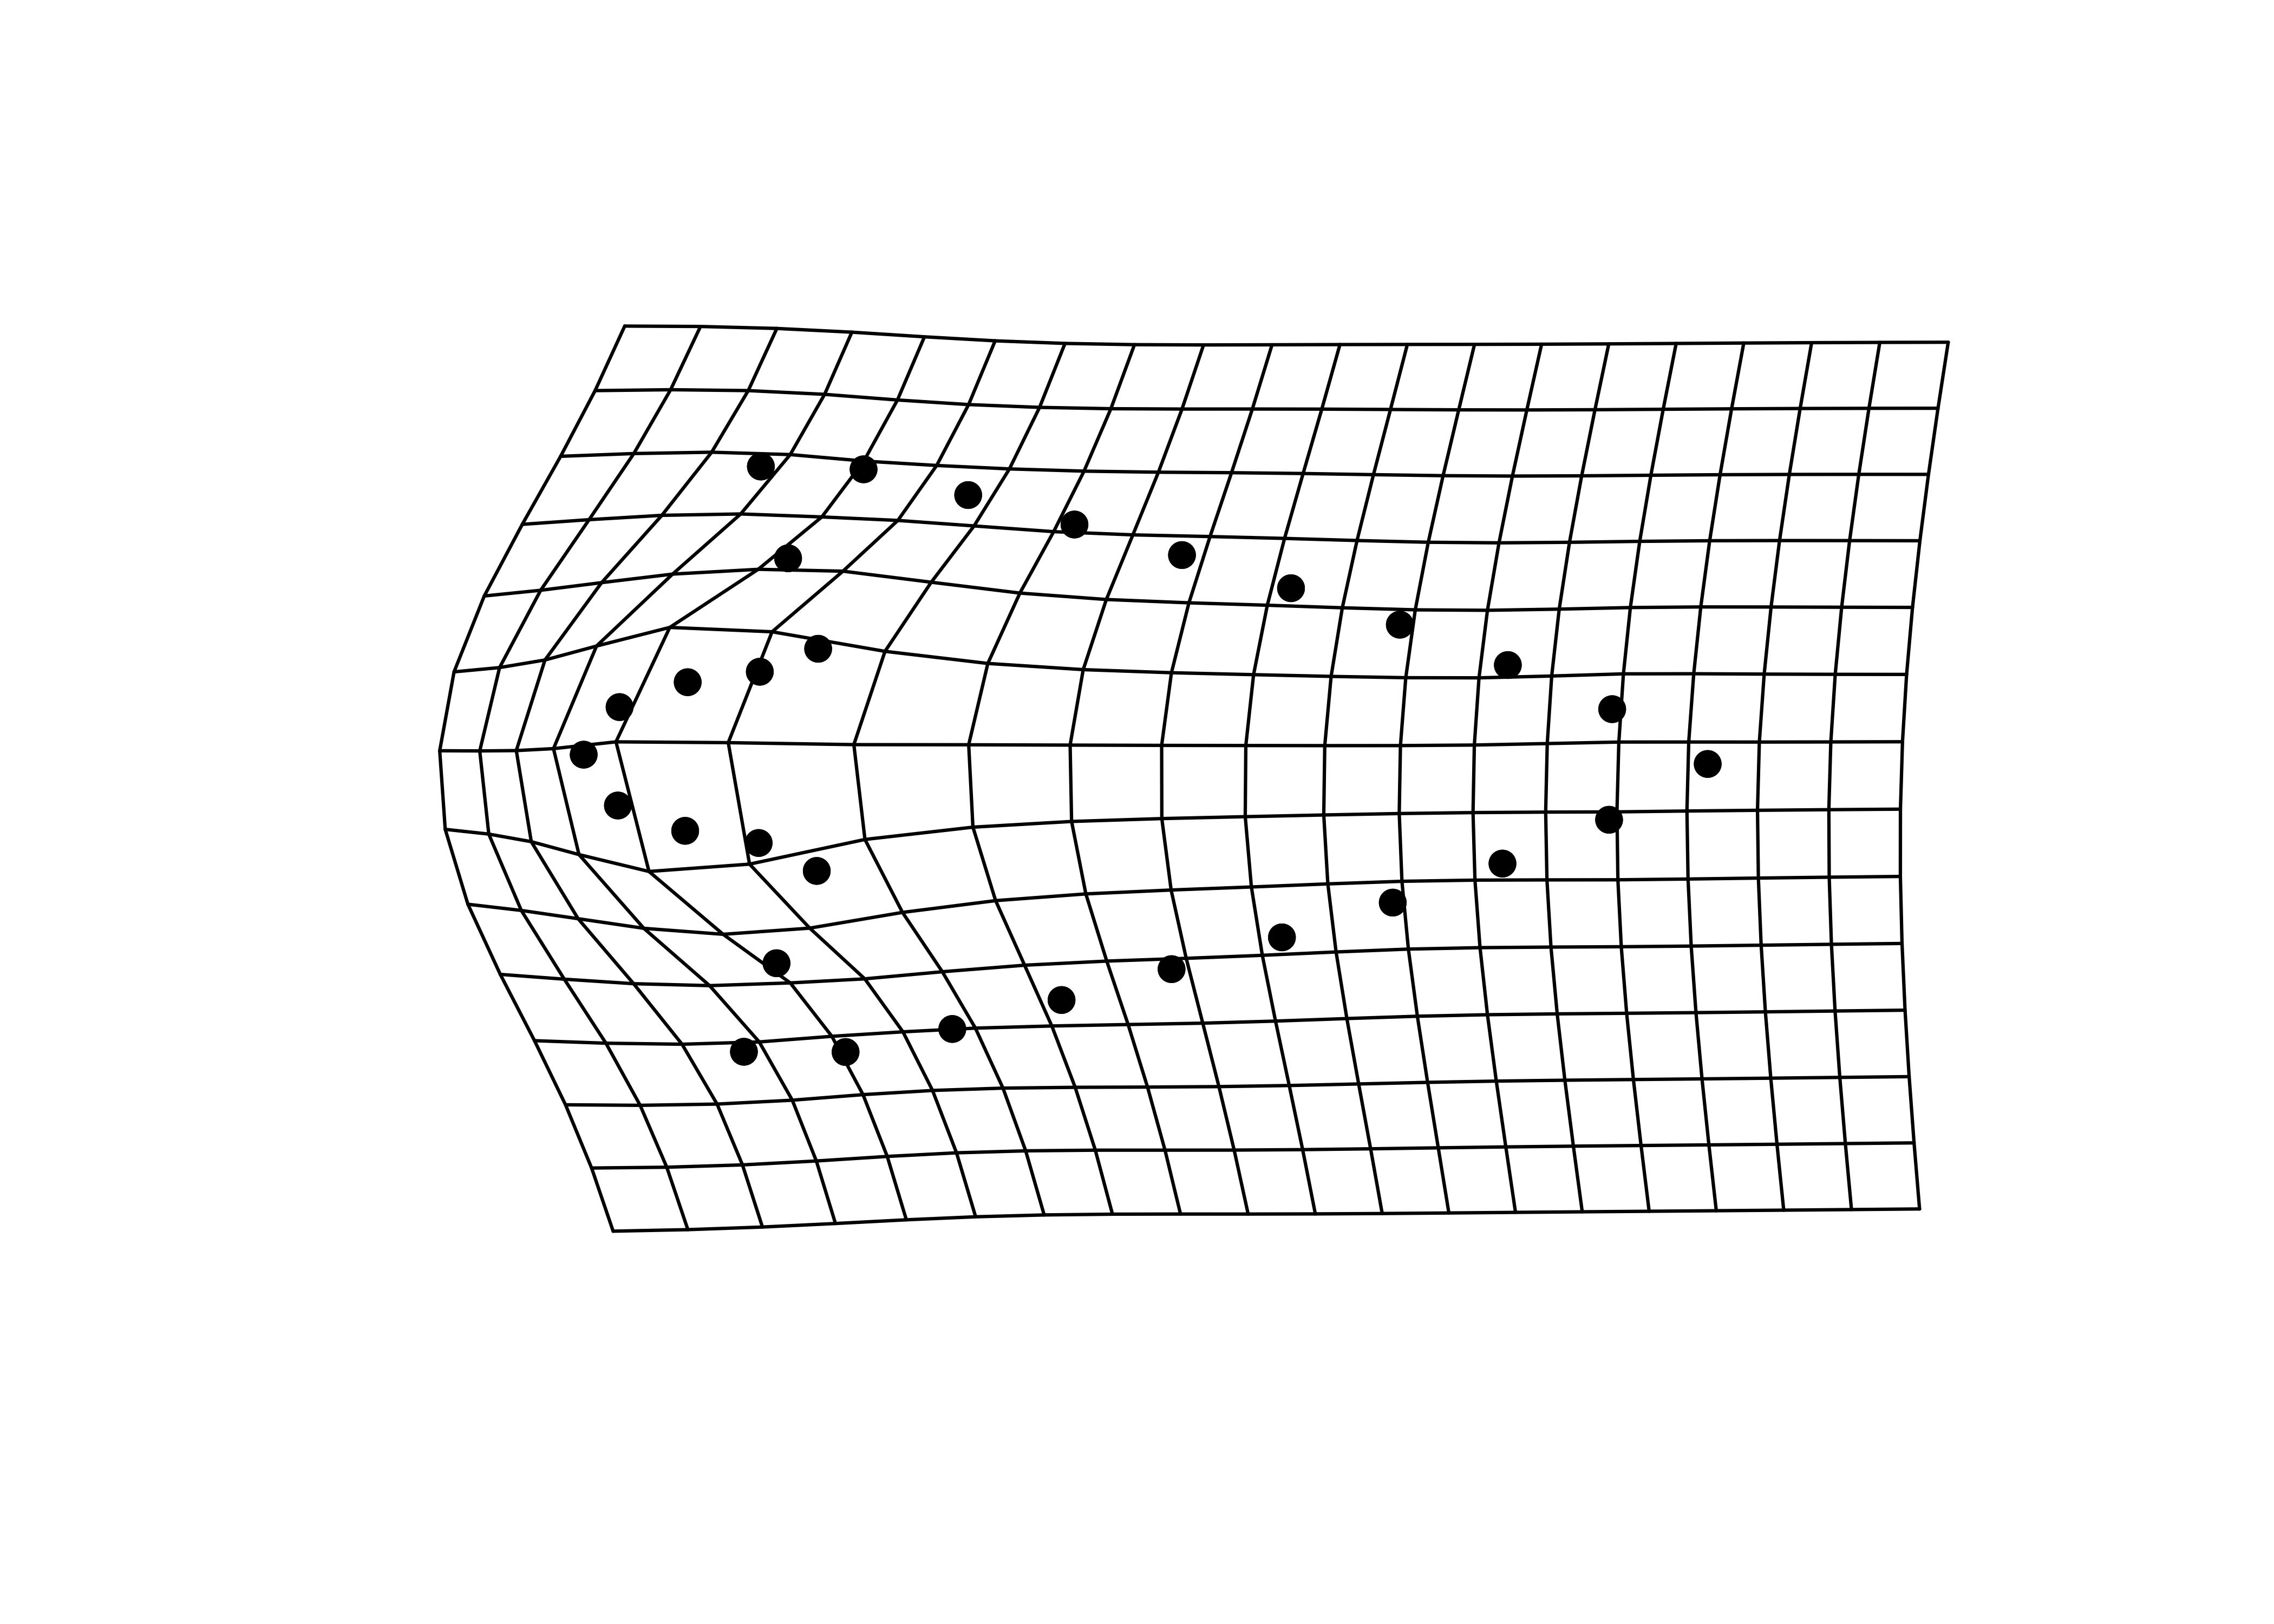
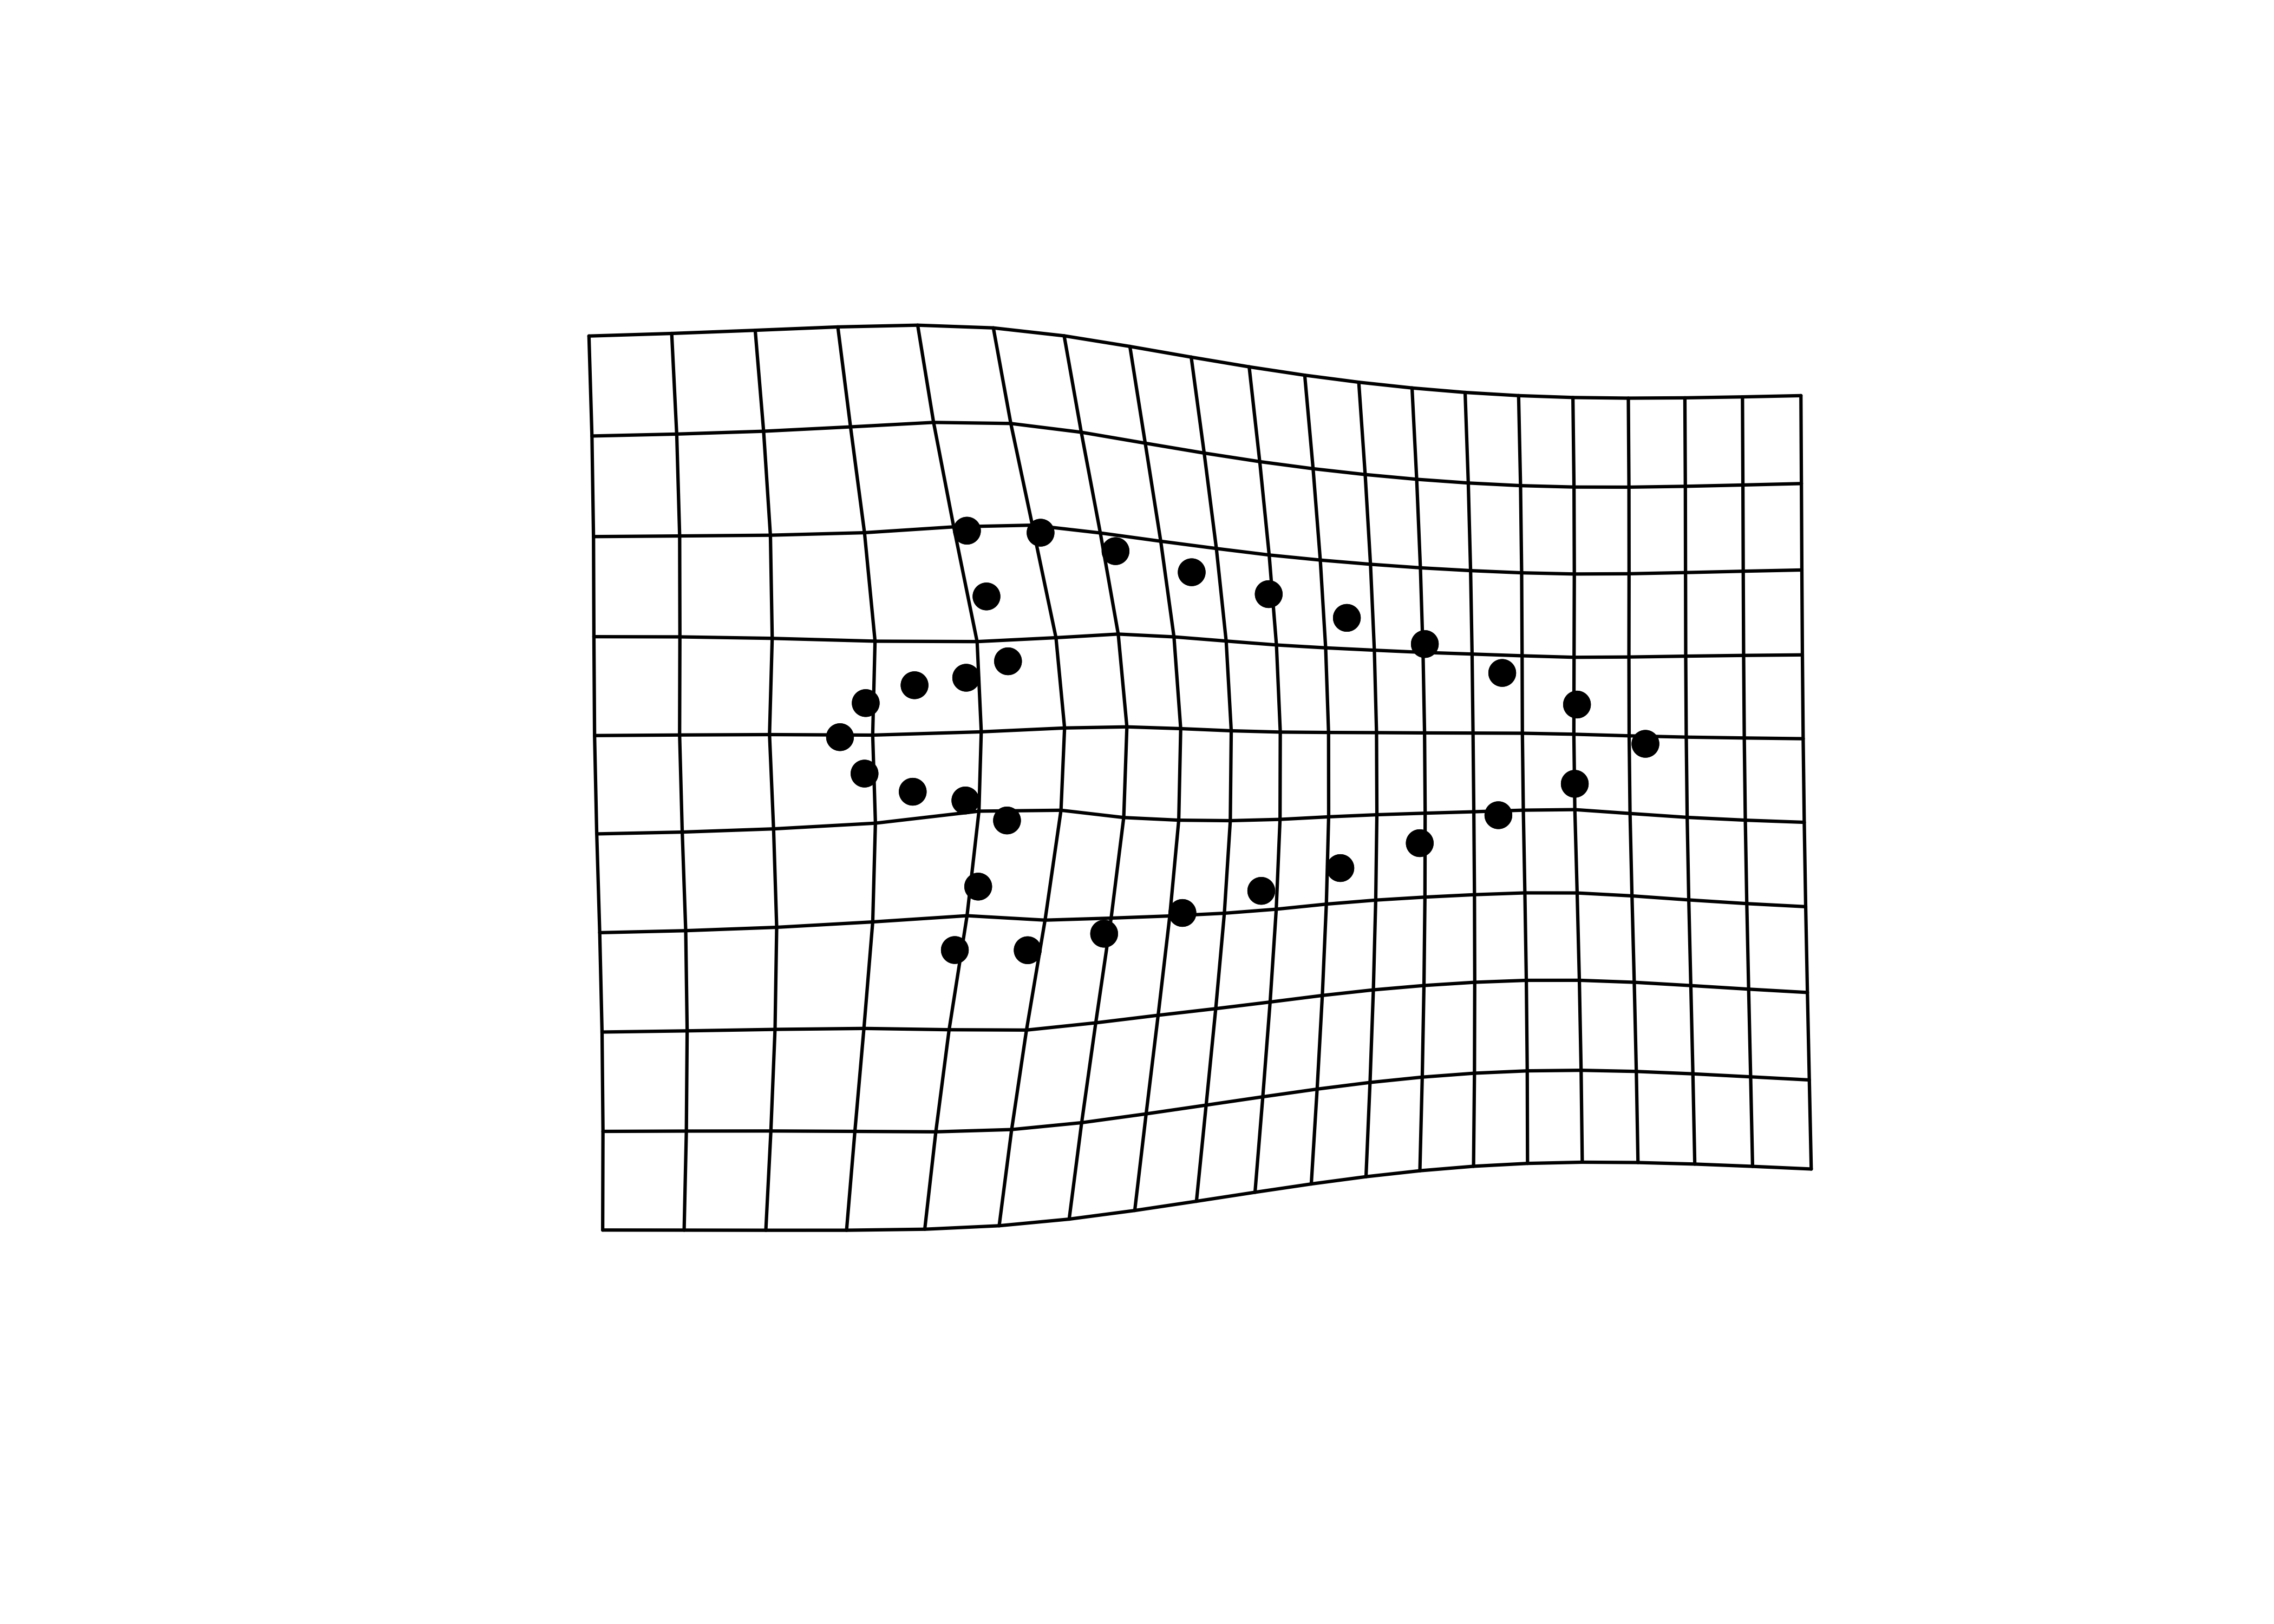
Minima/maxima of PC1/2 with warp grids

# plot x/y maxima/minima
## x - minima
mean.shape <- mshape(Y.gpa$coords)
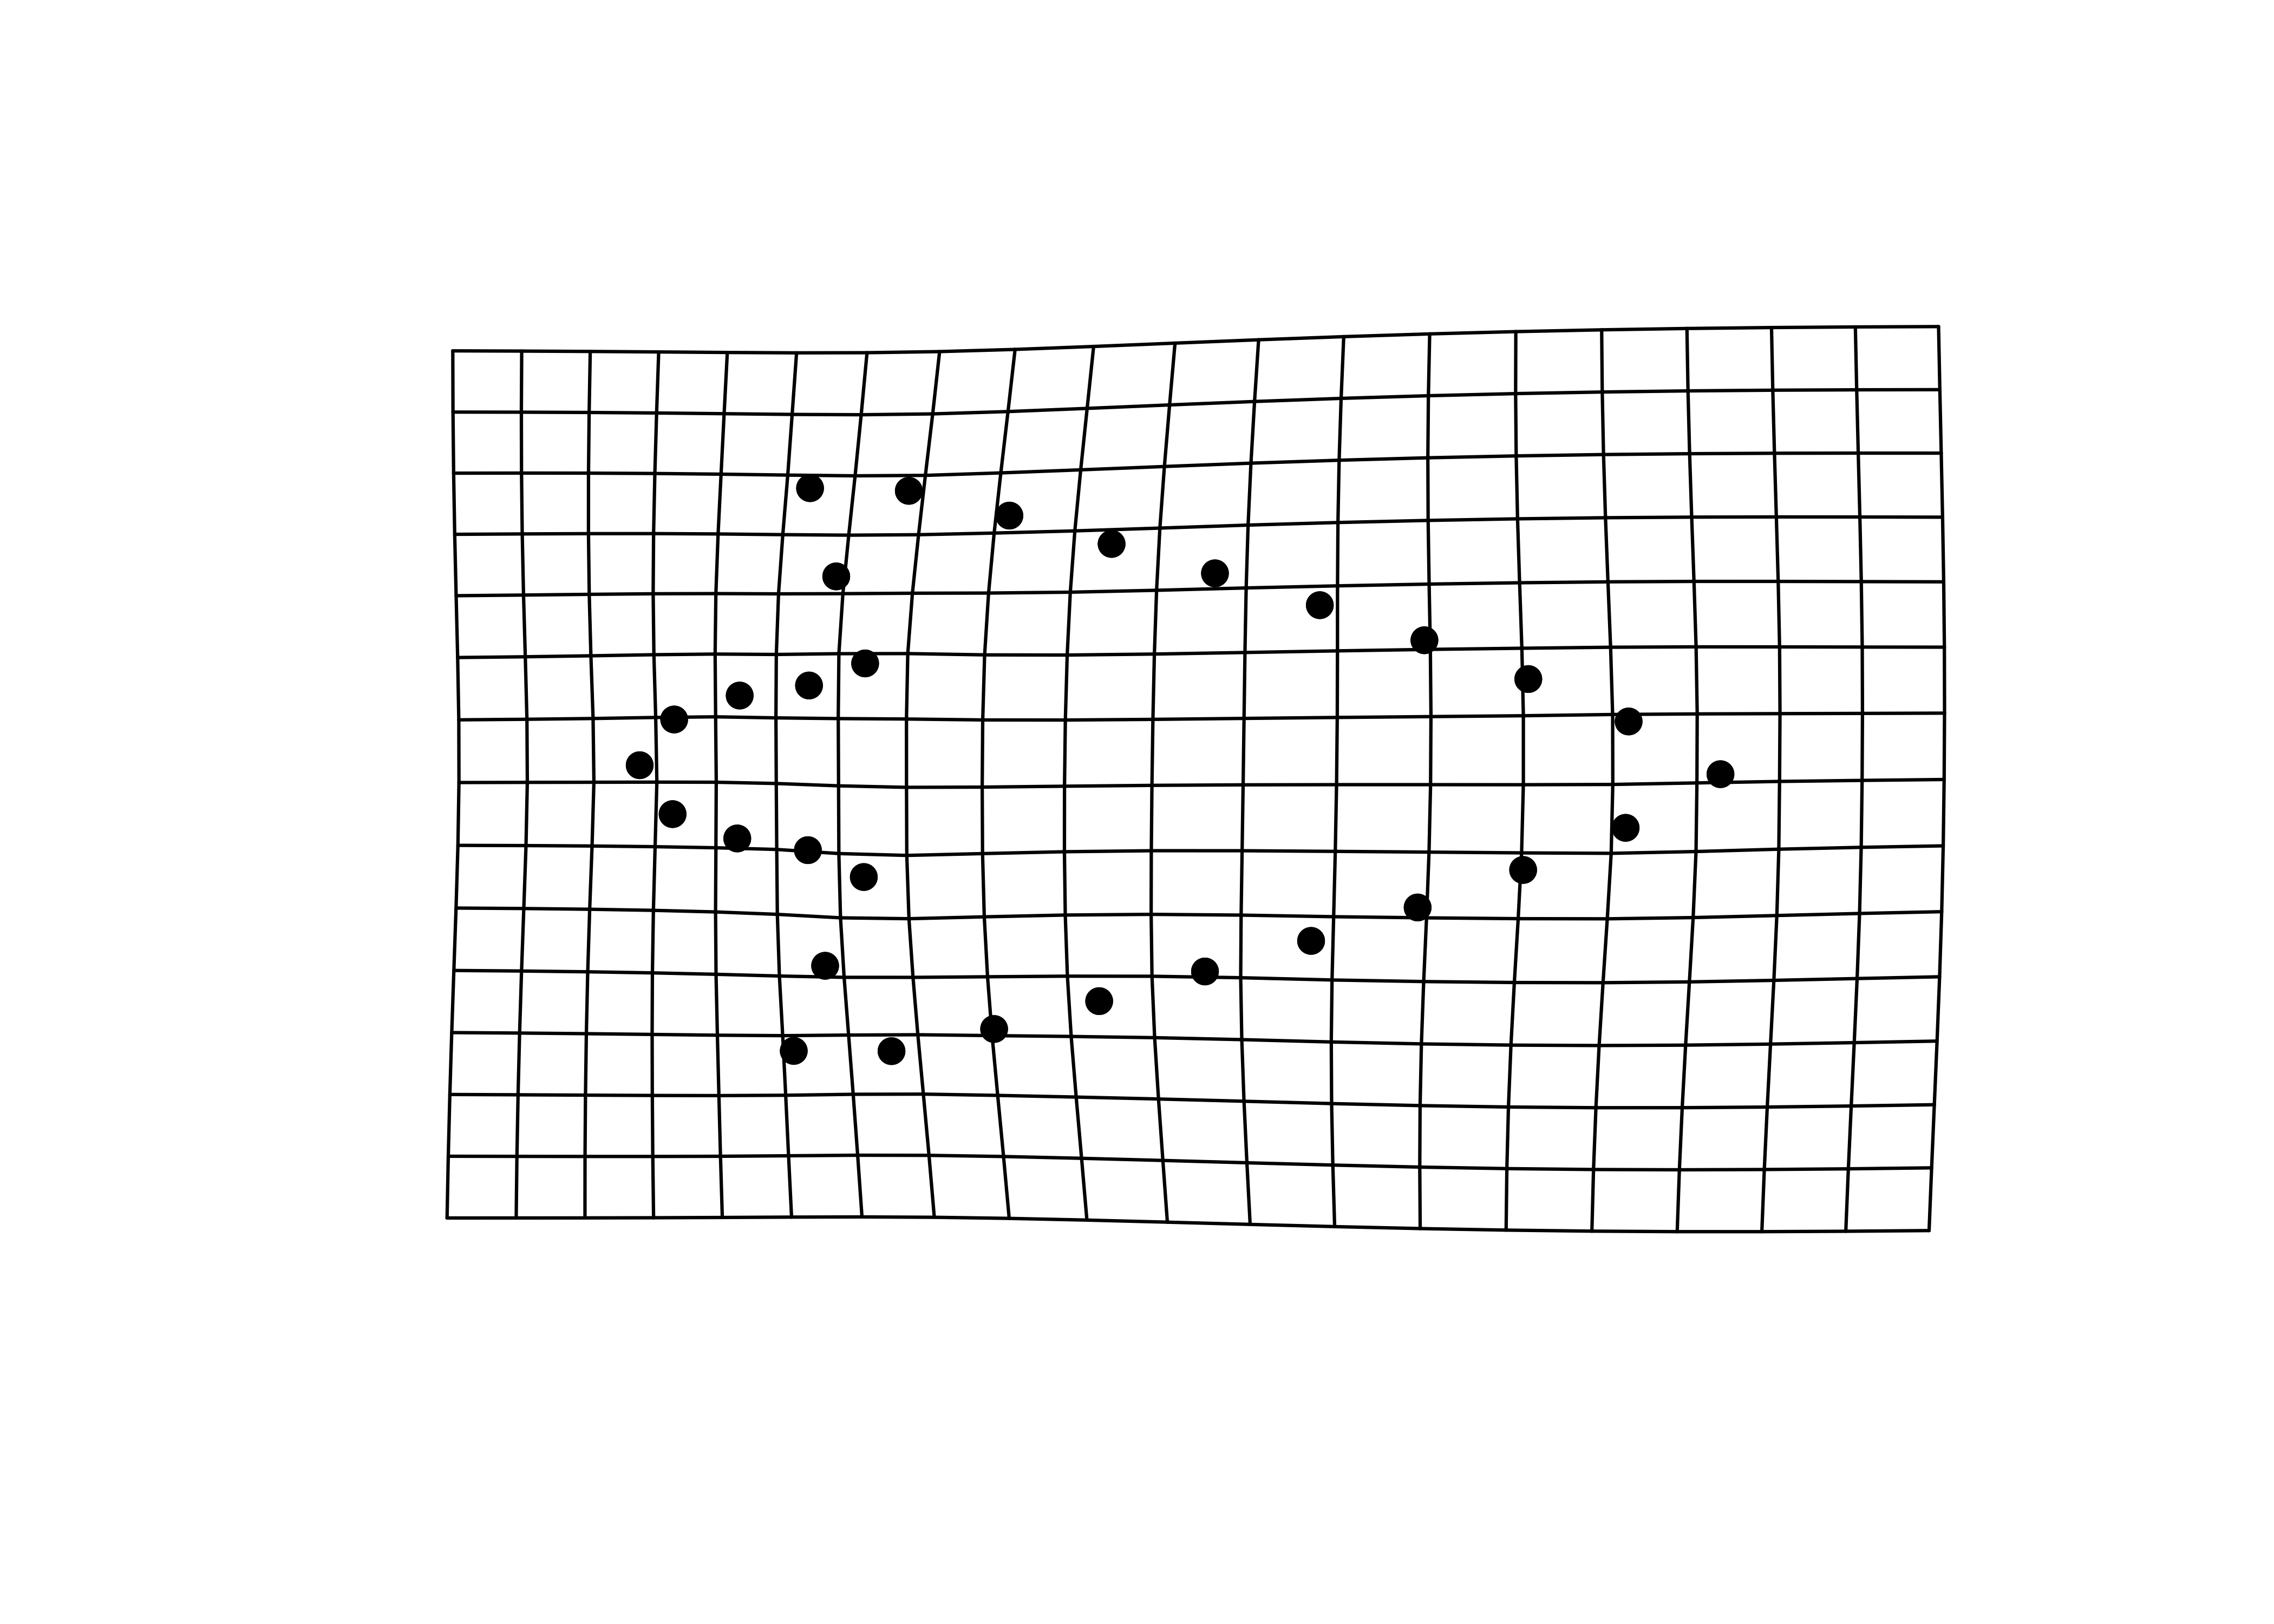
plotRefToTarget(pca$shapes$shapes.comp1$min, 
                mean.shape)

## x - maxima
plotRefToTarget(pca$shapes$shapes.comp1$max, 
                mean.shape)

## y - minima
plotRefToTarget(pca$shapes$shapes.comp2$min, 
                mean.shape)

## y - maxima
plotRefToTarget(pca$shapes$shapes.comp2$max, 
                mean.shape)

Composite PCA with warp grids

## plot composite pca with PC1/2 max/min
knitr::include_graphics('figures/gm-pca.jpg')

Procrustes ANOVA: Shape and size

# shape
fit.sh.reg <- procD.lm(shape ~ region,
                       data = gdf,
                       print.progress = FALSE,
                       iter = 9999)

# shape
anova(fit.sh.reg)

Analysis of Variance, using Residual Randomization
Permutation procedure: Randomization of null model residuals 
Number of permutations: 10000 
Estimation method: Ordinary Least Squares 
Sums of Squares and Cross-products: Type I 
Effect sizes (Z) based on F distributions

          Df      SS       MS    Rsq      F     Z Pr(>F)  
region     1 0.04296 0.042962 0.0536 3.6811 2.077 0.0161 *
Residuals 65 0.75862 0.011671 0.9464                      
Total     66 0.80158                                      
---
Signif. codes:  0 '***' 0.001 '**' 0.01 '*' 0.05 '.' 0.1 ' ' 1

Call: procD.lm(f1 = shape ~ region, iter = 9999, data = gdf, print.progress = FALSE)
# size
fit.sz.reg <- procD.lm(size ~ region,
                       data = gdf,
                       print.progress = FALSE,
                       iter = 9999)

# size
anova(fit.sz.reg)

Analysis of Variance, using Residual Randomization
Permutation procedure: Randomization of null model residuals 
Number of permutations: 10000 
Estimation method: Ordinary Least Squares 
Sums of Squares and Cross-products: Type I 
Effect sizes (Z) based on F distributions

          Df     SS      MS     Rsq      F      Z Pr(>F)    
region     1 20.277 20.2766 0.30681 28.769 3.7643  1e-04 ***
Residuals 65 45.812  0.7048 0.69319                         
Total     66 66.089                                         
---
Signif. codes:  0 '***' 0.001 '**' 0.01 '*' 0.05 '.' 0.1 ' ' 1

Call: procD.lm(f1 = size ~ region, iter = 9999, data = gdf, print.progress = FALSE)

Modularity

land.gps <- c("A","A","B","B","B","A","A","A","A","A","A","A","A","A",
              "B","B","B","B","B","B","B","B","A","A","A","A","A","A",
              "A","A")

mod <- modularity.test(Y.gpa$coords,
                       partition.gp = land.gps,
                       iter = 9999,
                       seed = NULL,
                       opt.rot = TRUE,
                       print.progress = FALSE)

summary(mod)

Call:
modularity.test(A = Y.gpa$coords, partition.gp = land.gps, iter = 9999,  
    seed = NULL, opt.rot = TRUE, print.progress = FALSE) 


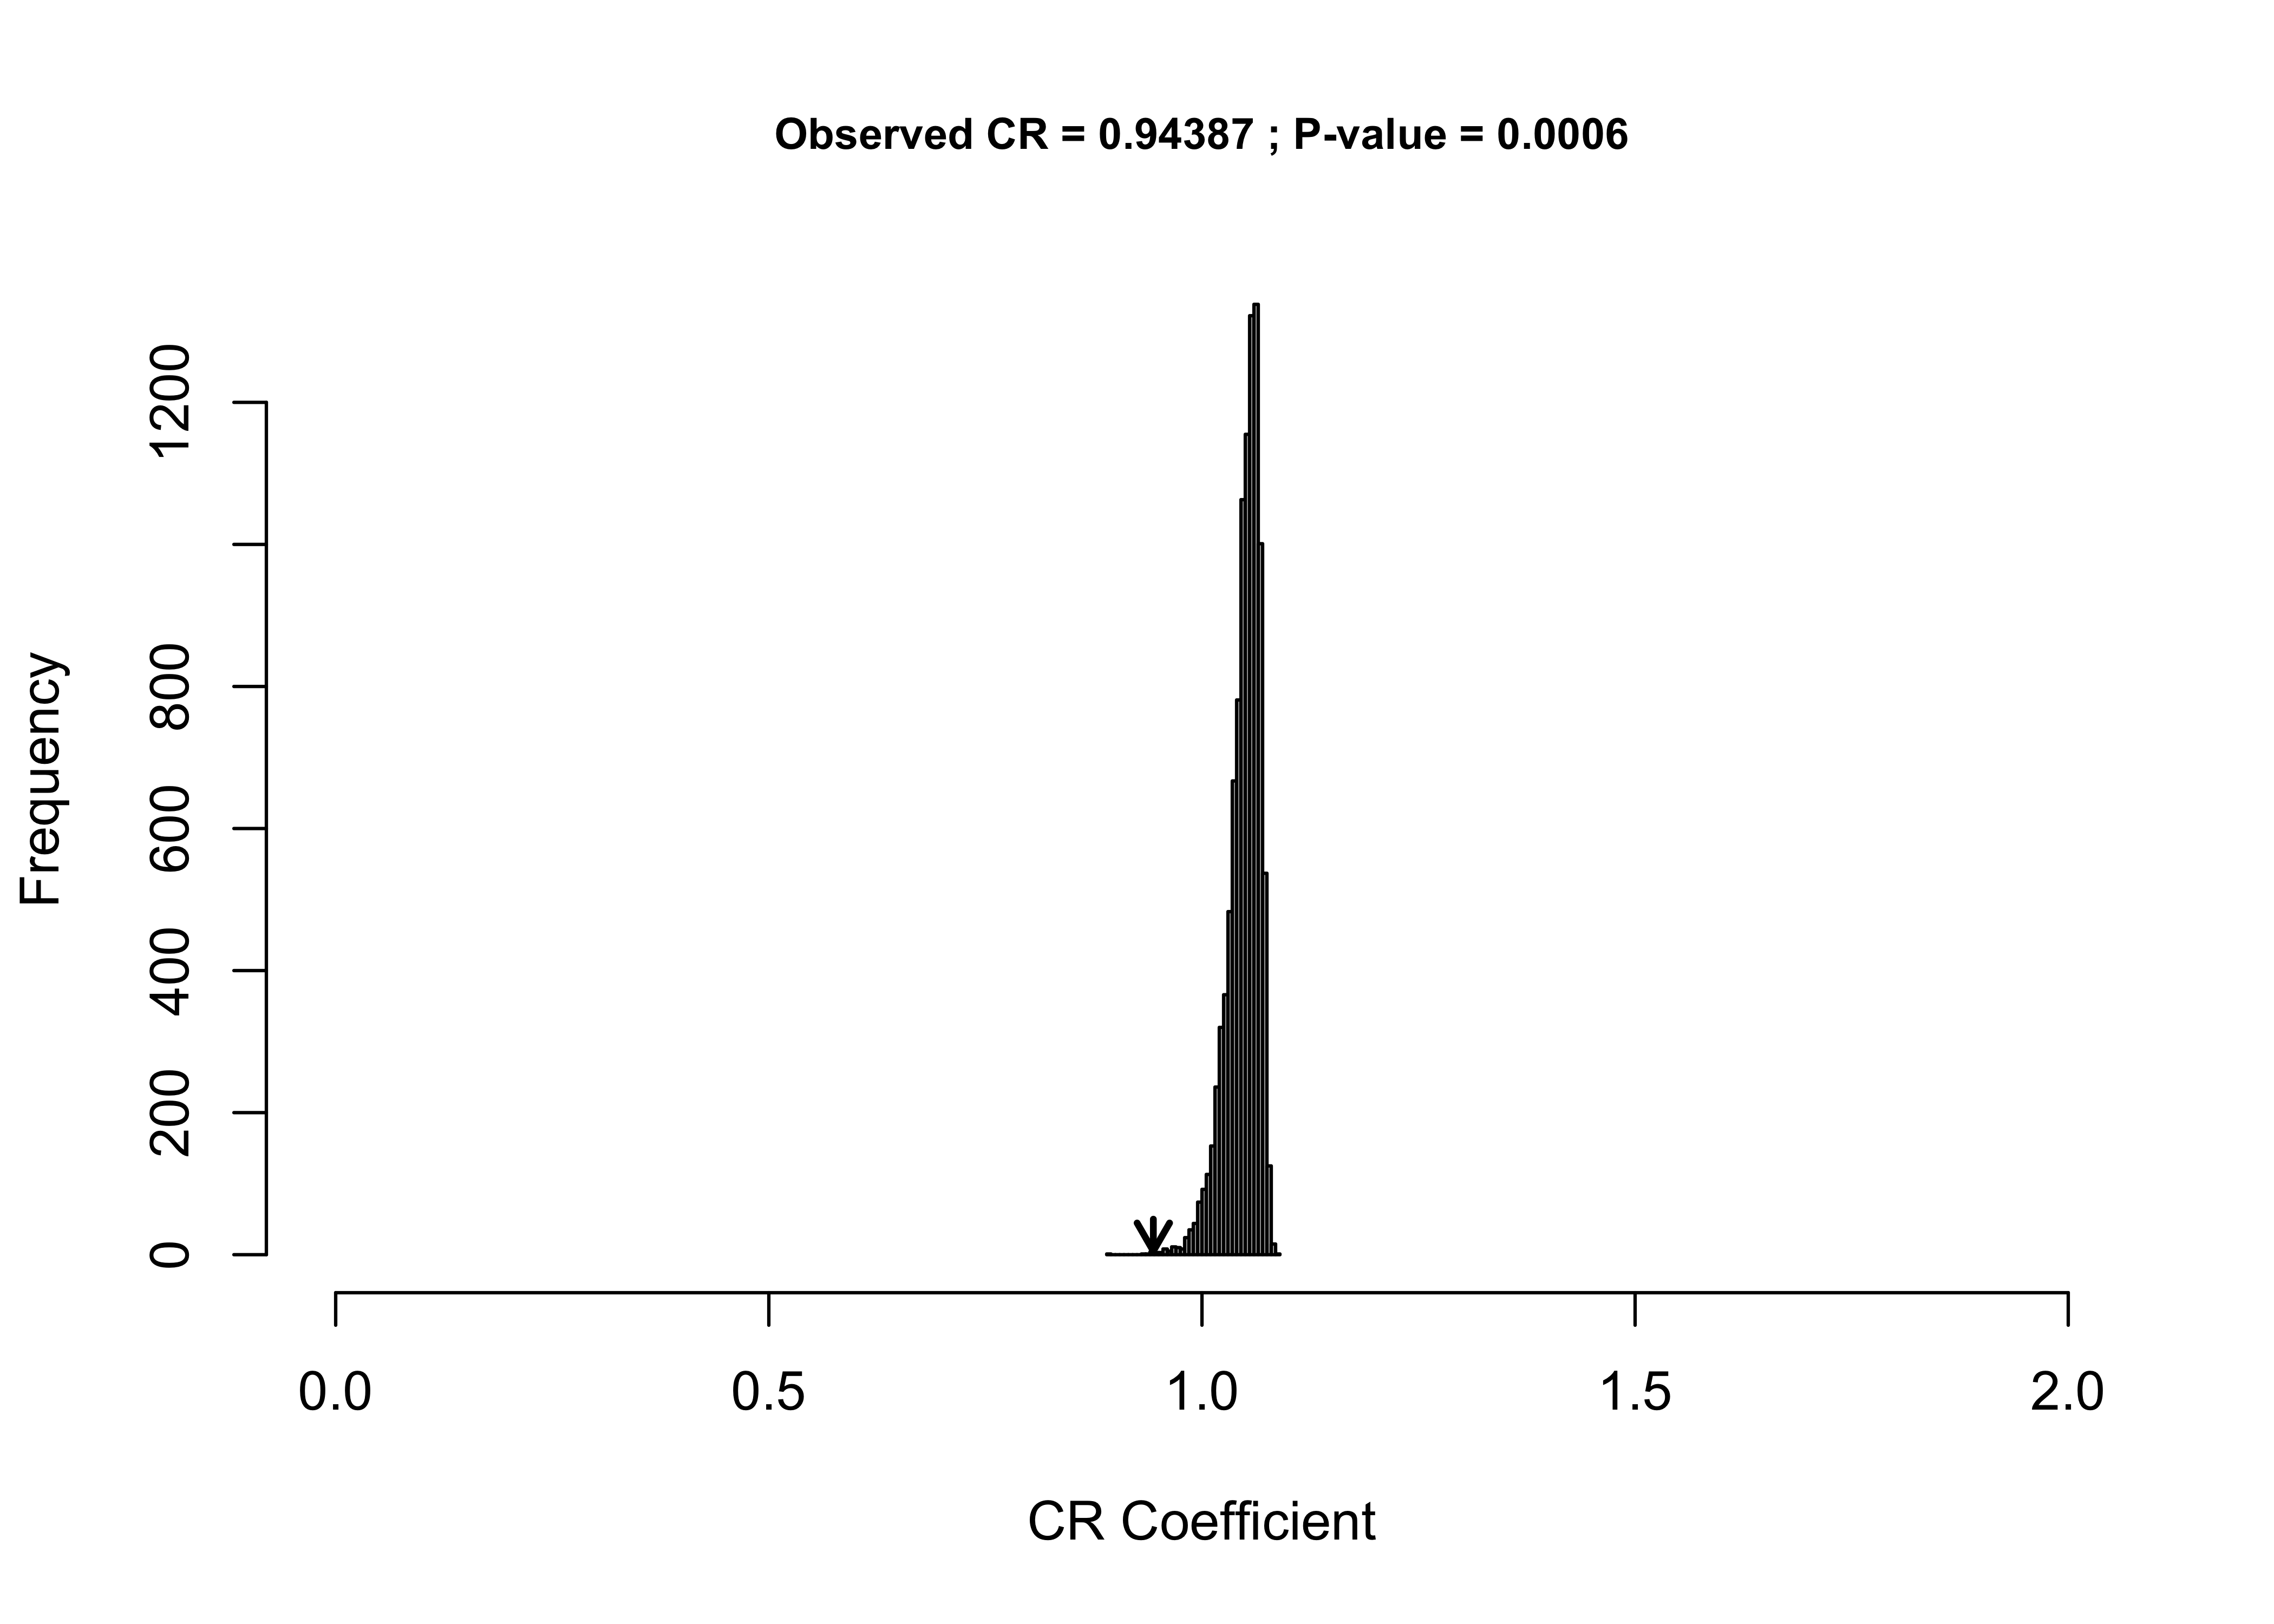
CR: 0.94387

P-value: 6e-04

Effect Size: -4.7686

Based on 10000 random permutations
## modularity plot
plot(mod)

Morphological integration

it <- integration.test(Y.gpa$coords,
                       partition.gp = land.gps,
                       print.progress = FALSE,
                       iter = 9999)

summary(it)

Call:
integration.test(A = Y.gpa$coords, partition.gp = land.gps, iter = 9999,  
    print.progress = FALSE) 


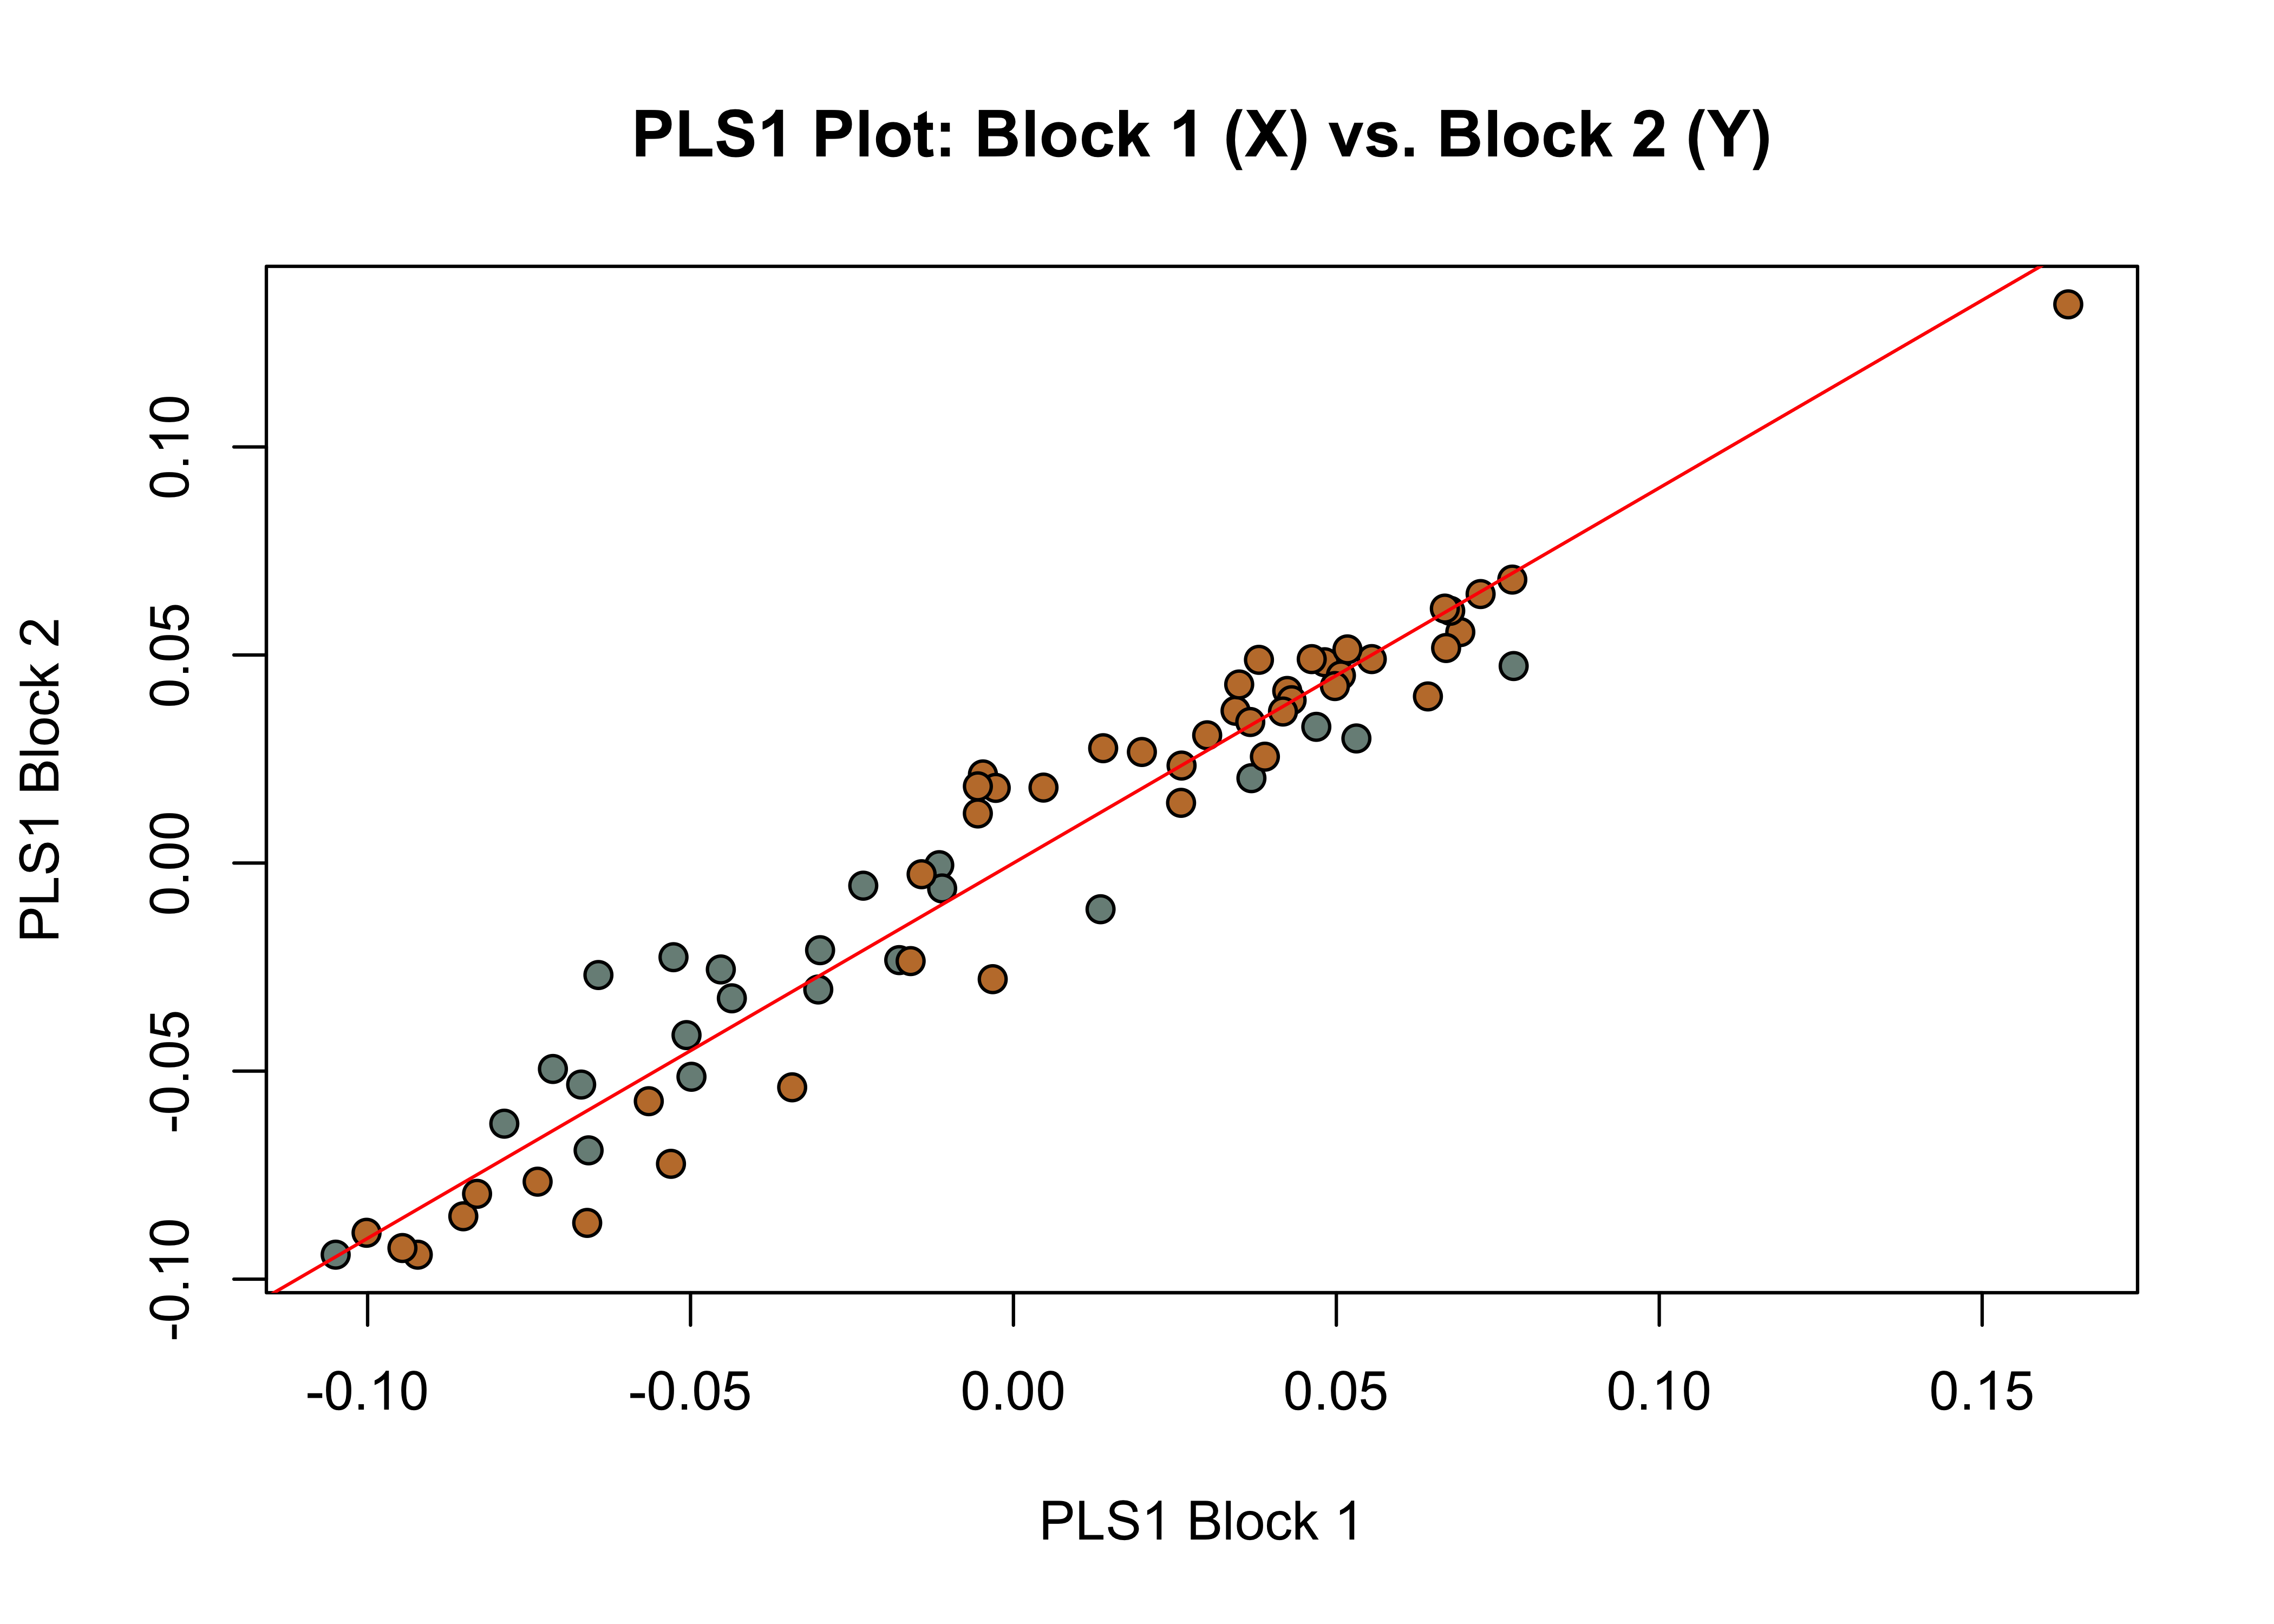
r-PLS: 0.9676

Effect Size (Z): 6.23893

P-value: 1e-04

Based on 10000 random permutations
## integration plot
plot(it,
     pch = 21,
     bg = qdata$clr,
     cex = 1.1)

Morphological disparity

# morphological disparity by shape
morphol.disparity(fit.sh.reg, 
                  groups = qdata$region, 
                  data = gdf, 
                  print.progress = FALSE, 
                  iter = 9999)

Call:
morphol.disparity(f1 = fit.sh.reg, groups = qdata$region, iter = 9999,  
    data = gdf, print.progress = FALSE) 


Randomized Residual Permutation Procedure Used
10000 Permutations

Procrustes variances for defined groups
      north       south 
0.008772021 0.012569634 


Pairwise absolute differences between variances
            north       south
north 0.000000000 0.003797614
south 0.003797614 0.000000000


P-Values
       north  south
north 1.0000 0.1435
south 0.1435 1.0000
# morphological disparity by size
morphol.disparity(fit.sz.reg, 
                  groups = qdata$region, 
                  data = gdf, 
                  print.progress = FALSE, 
                  iter = 9999)

Call:
morphol.disparity(f1 = fit.sz.reg, groups = qdata$region, iter = 9999,  
    data = gdf, print.progress = FALSE) 


Randomized Residual Permutation Procedure Used
10000 Permutations

Procrustes variances for defined groups
    north     south 
0.3070126 0.8679523 


Pairwise absolute differences between variances
          north     south
north 0.0000000 0.5609397
south 0.5609397 0.0000000


P-Values
       north  south
north 1.0000 0.0603
south 0.0603 1.0000

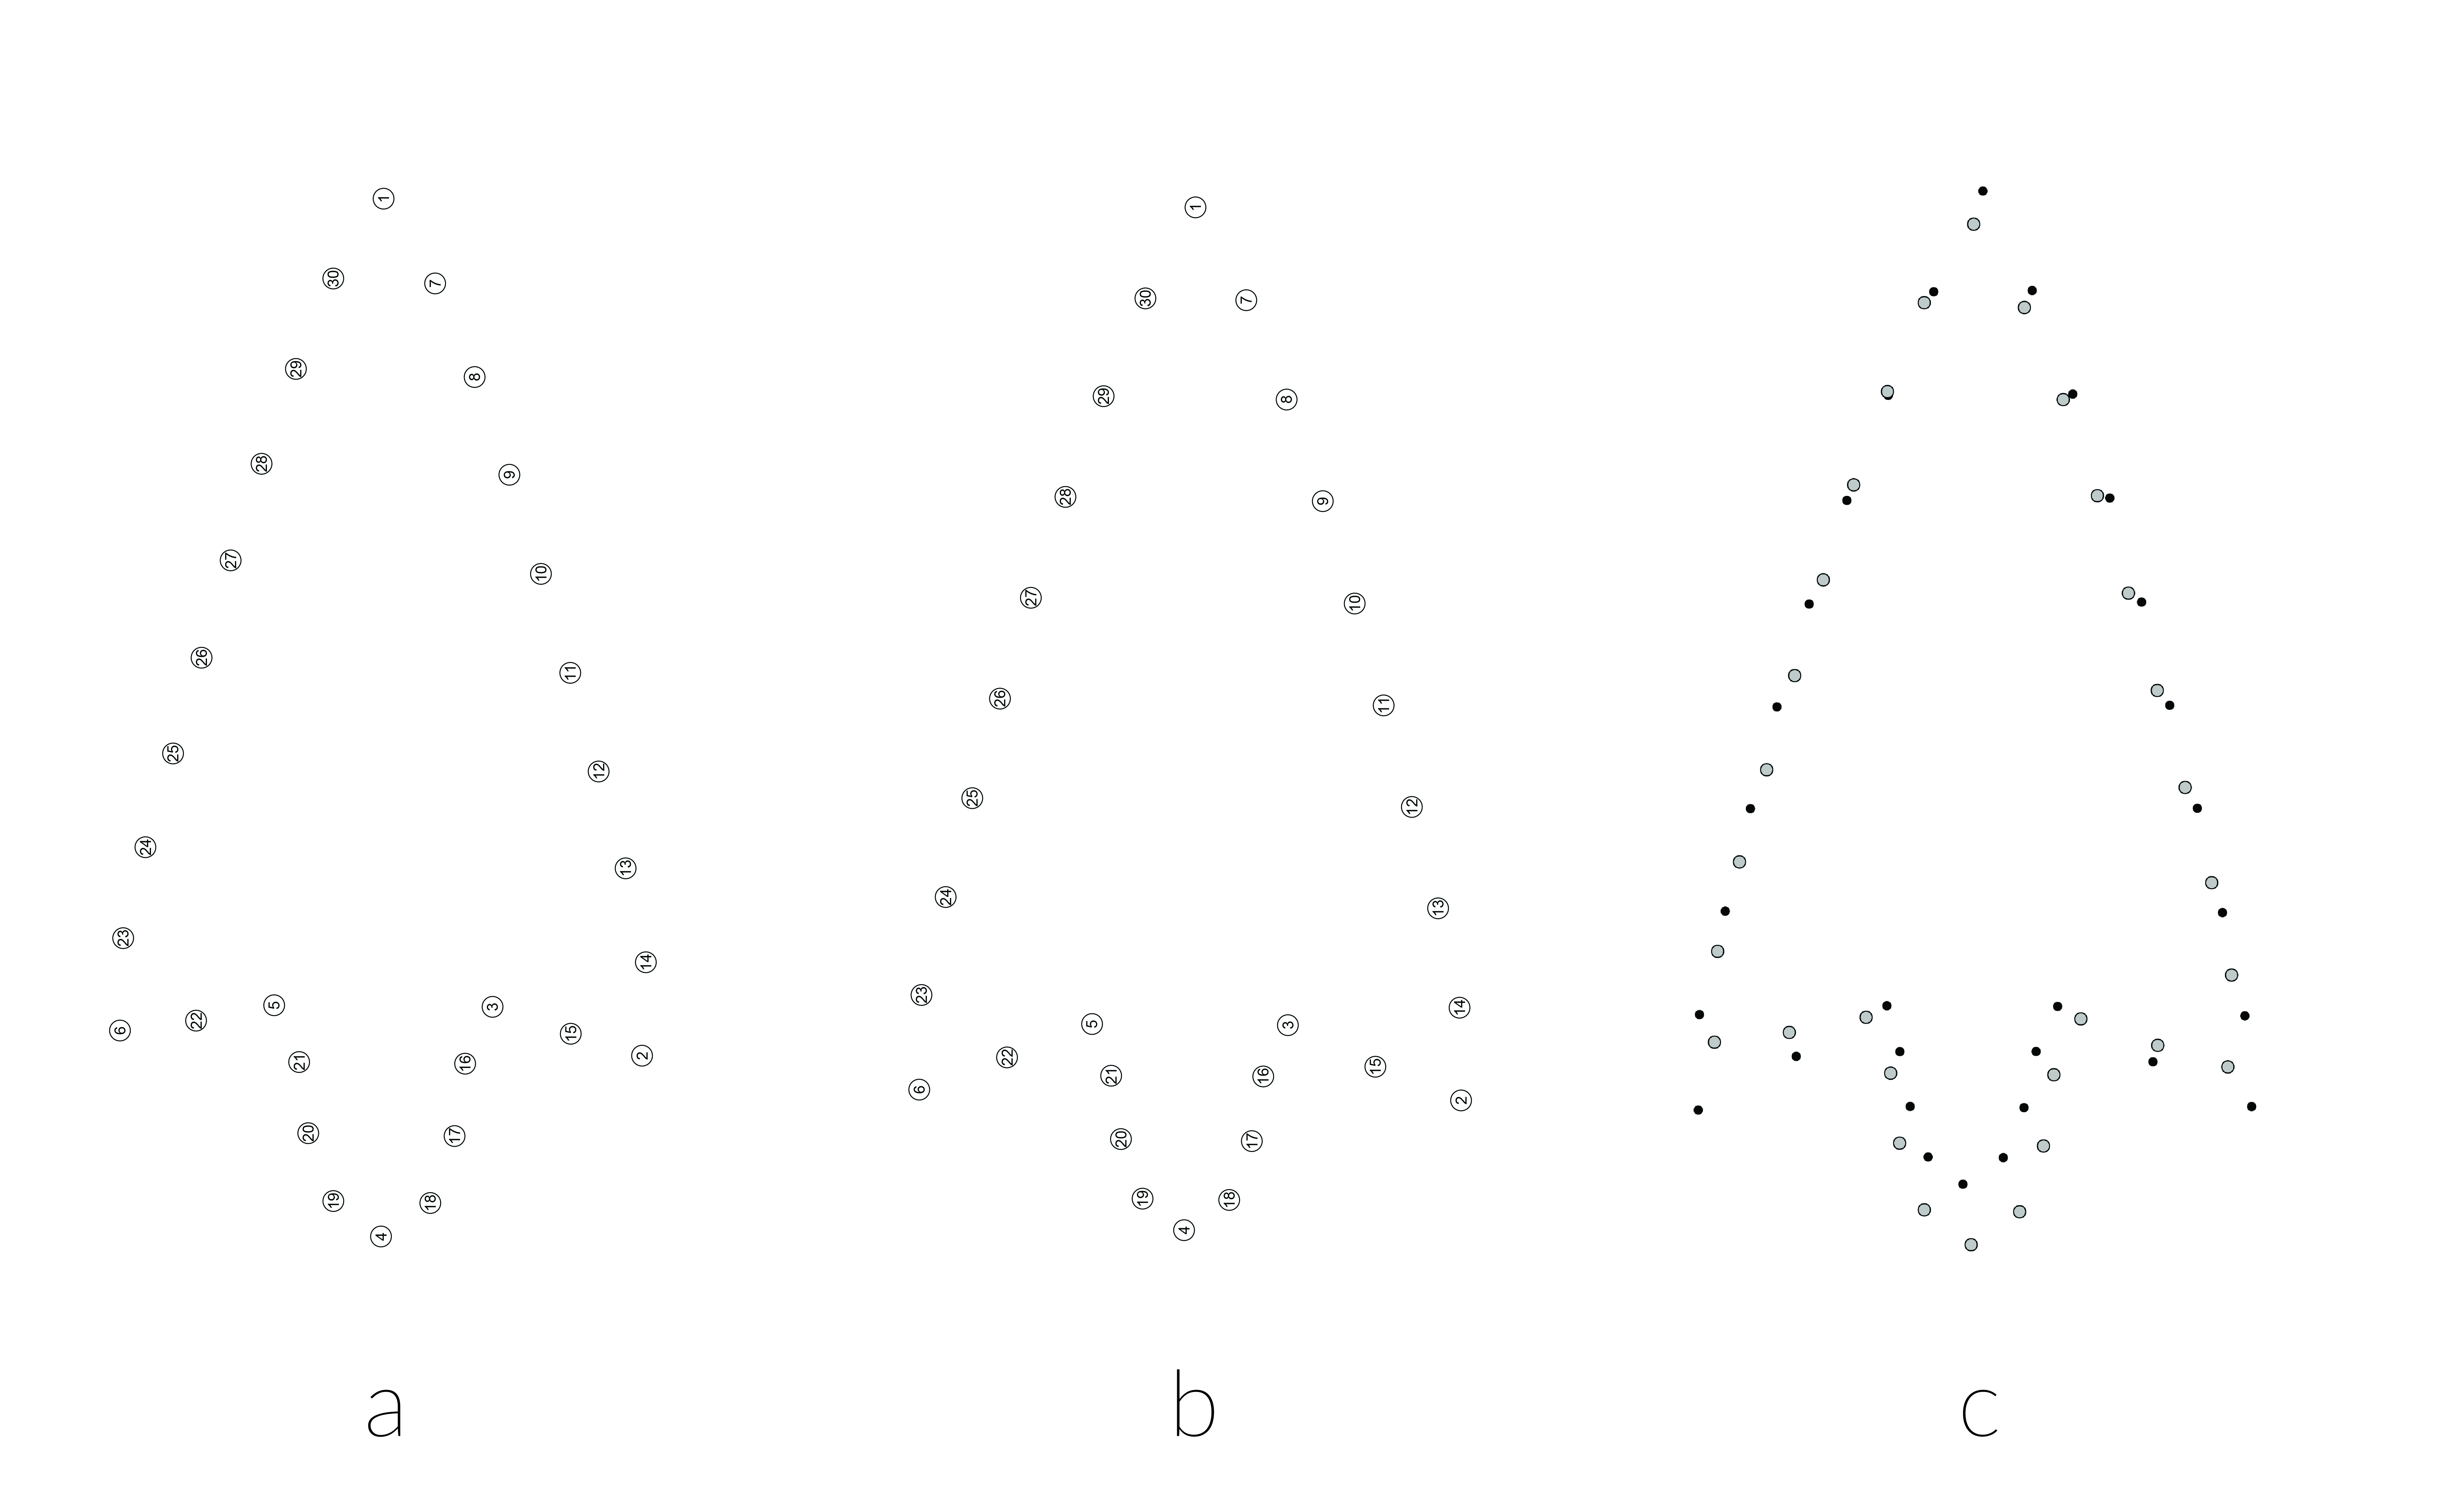
Mean shapes

# subset landmark coordinates to produce mean shapes
new.coords <- coords.subset(A = Y.gpa$coords,
                            group = qdata$region)
names(new.coords)
[1] "north" "south"
# group shape means
mean <- lapply(new.coords, mshape)

## plot mean shape north
plot(mean$north)

## plot mean shape south
plot(mean$south)

## comparison plot
plotRefToTarget(mean$north,
                mean$south,
                method = "points",
                mag = 1,
                useRefPts = TRUE)

## composite figure
knitr::include_graphics('figures/gm-mshape.jpg')