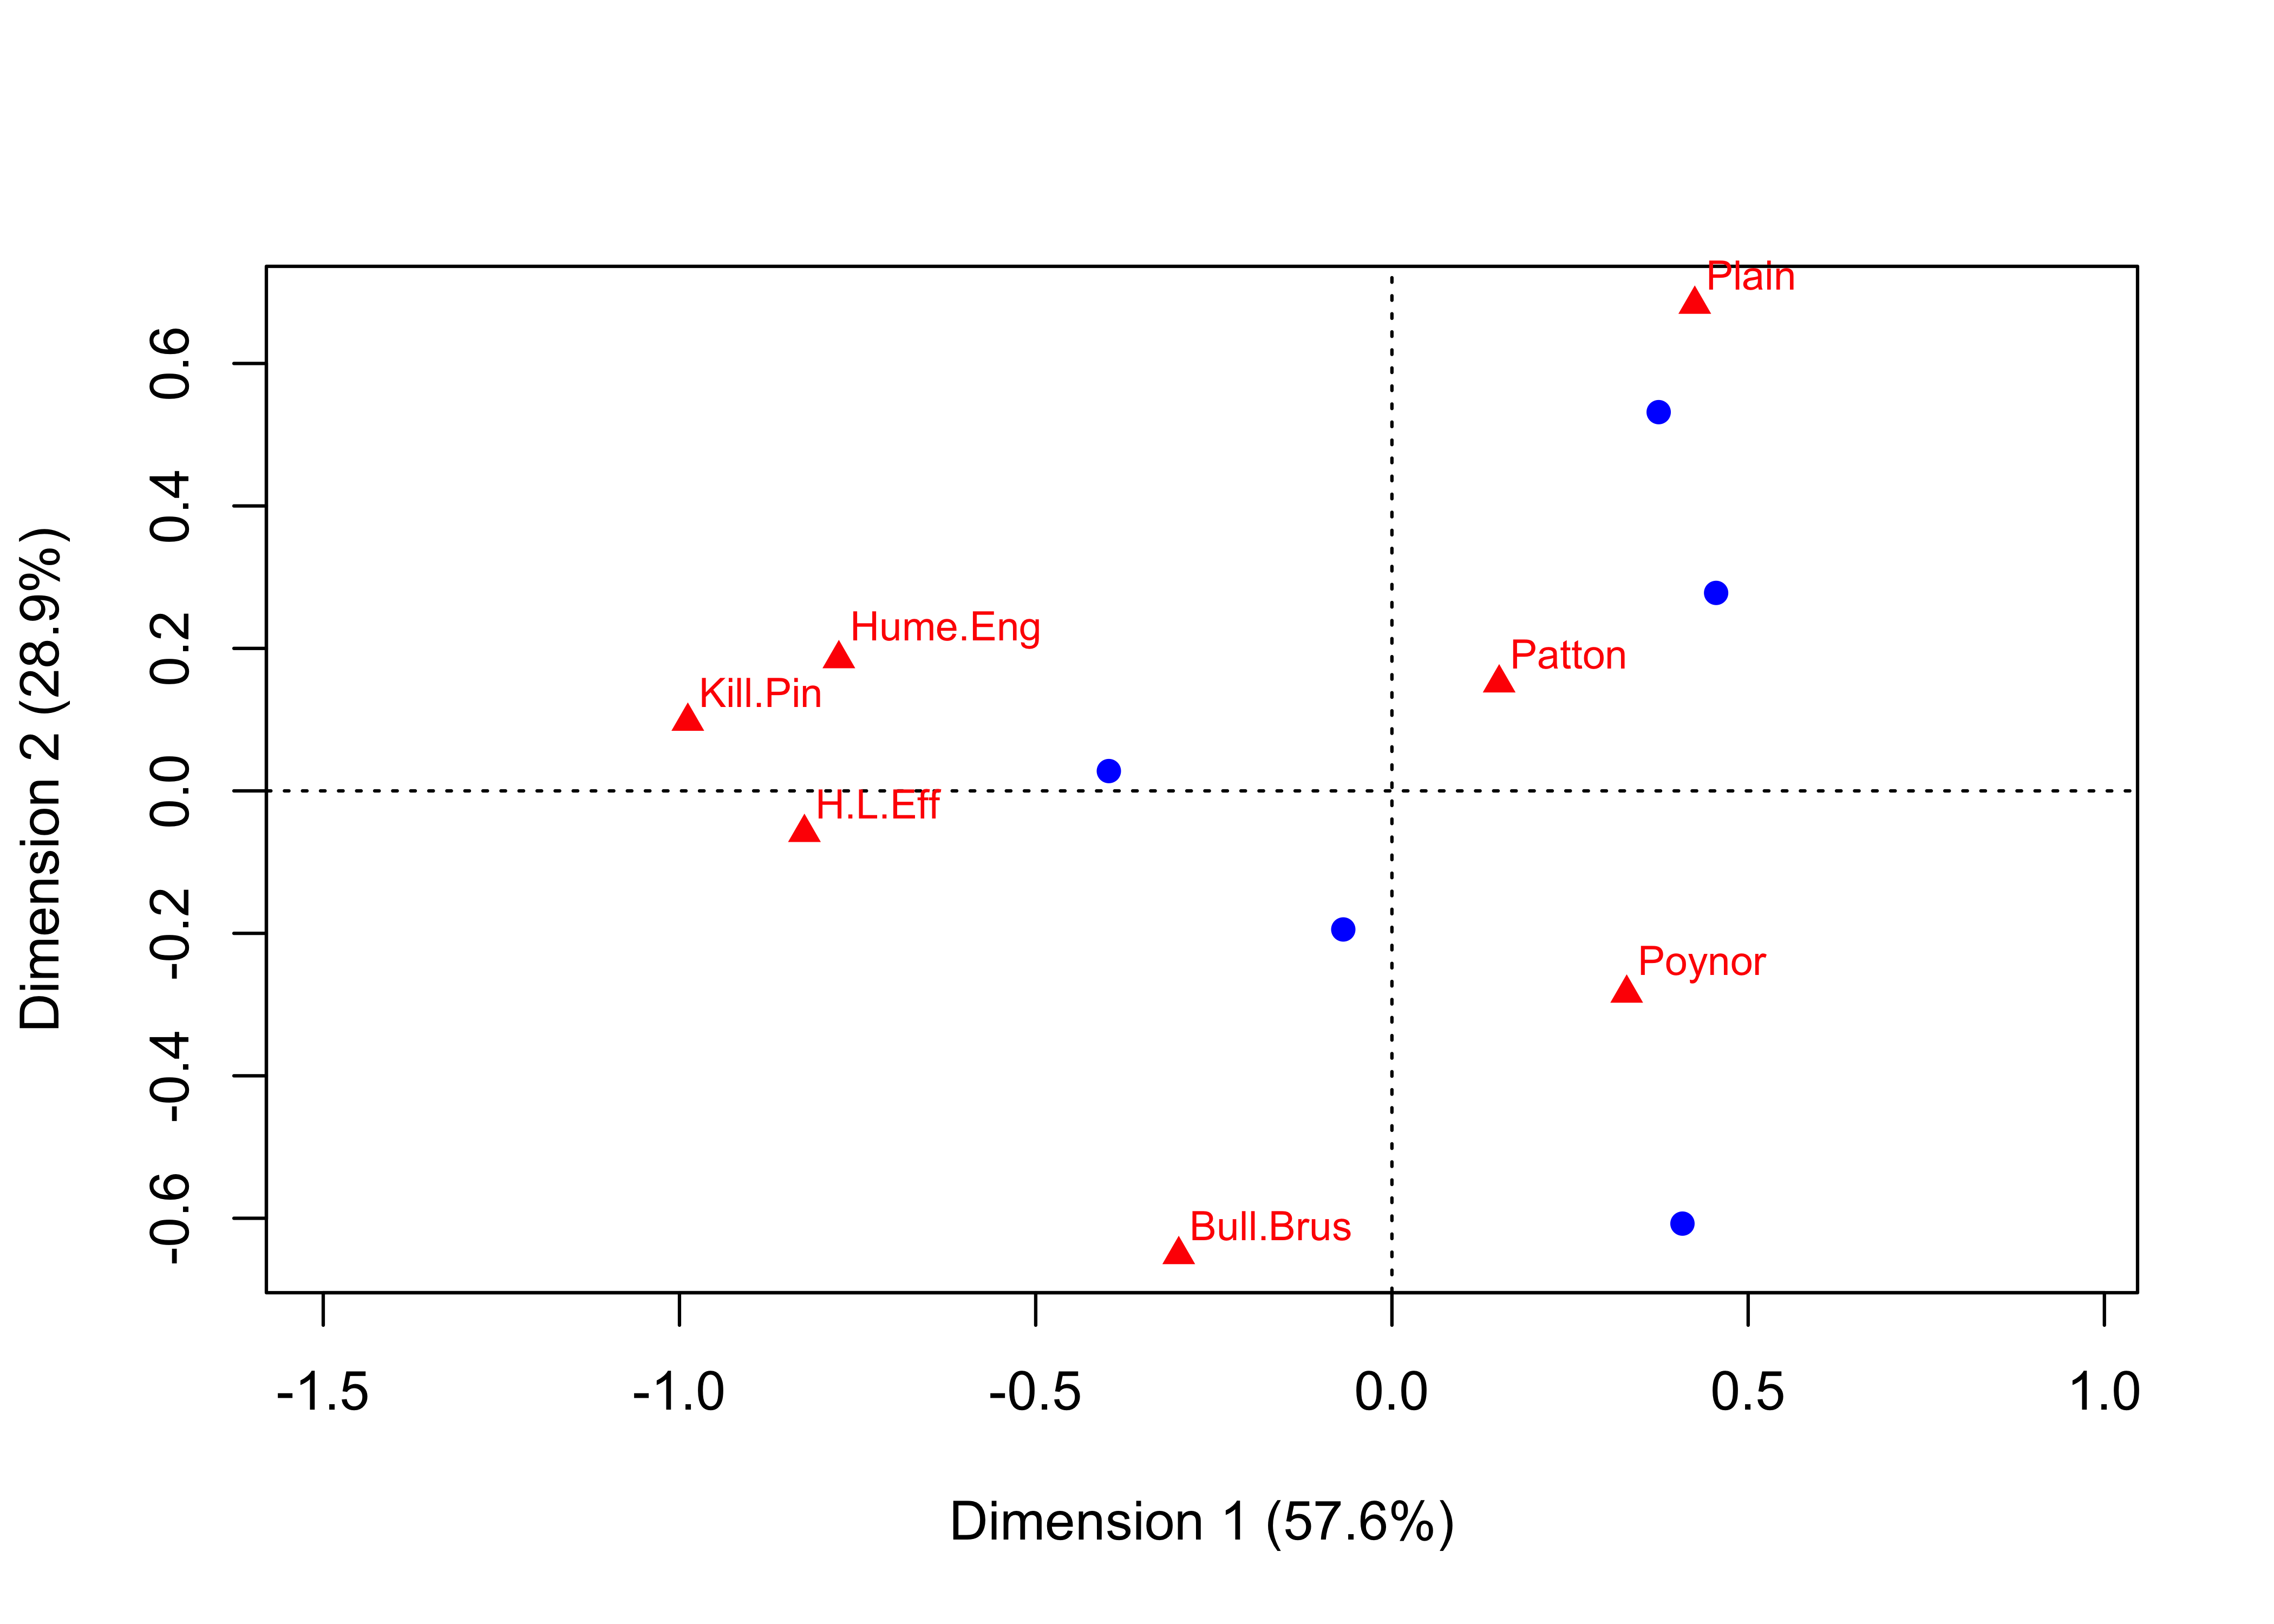
Attaching package: 'dplyr'
The following objects are masked from 'package:stats':

    filter, lag
The following objects are masked from 'package:base':

    intersect, setdiff, setequal, union
library (ca)library (plotrix)library (kableExtra)
Attaching package: 'kableExtra'
The following object is masked from 'package:dplyr':

    group_rows
# read data <- read.csv ("seriate.allen.phase.csv" )# Row sums <- rowSums (data[, - (1 )]))# Column sums <- colSums (data[, - (1 )])as.matrix (CS)
          [,1]
Poynor      21
Patton      45
Hume.Eng    10
H.L.Eff      5
Kill.Pin     1
Bull.Brus    7
Plain        3
<- data[, - (1 )]<- paste0 (data$ Burial)rownames (burial_ct) <- labels<- burial_ct / RS * 100
Loading required package: permute
Loading required package: lattice
<- decorana (burial_ct)# Decorana Ordering on Projection 1 <- order (burial_dec$ rproj[, 1 ]))cor.test (ca_ord, dec_ord, method = "kendall" ))
    Kendall's rank correlation tau

data:  ca_ord and dec_ord
T = 5, p-value = 1
alternative hypothesis: true tau is not equal to 0
sample estimates:
tau
  0
detach ("package:vegan" )detach ("package:permute" )
Registered S3 method overwritten by 'seriation':
  method         from
  reorder.hclust vegan
Attaching package: 'seriation'
The following object is masked from 'package:lattice':

    panel.lines
<- dist (burial_pct, method= "manhattan" )# Distance matrix: round (burial_dist, 1 )
                 AN21-E-Owens-1Bur CE6-Hackney-2Bur CE12-Allen-18Bur
CE6-Hackney-2Bur              85.7
CE12-Allen-18Bur             118.2             53.2
AN13-Jowell-Pur              123.1             65.9             73.1
AN26-Patton-Pur               74.1             57.1             74.4
                 AN13-Jowell-Pur
CE6-Hackney-2Bur
CE12-Allen-18Bur
AN13-Jowell-Pur
AN26-Patton-Pur             71.2
set.seed (42 )<- seriate (burial_dist, method= "ARSA" )<- seriate (burial_dist, method= "BBURCG" )<- seriate (burial_dist, method= "BBWRCG" )<- get_order (burial_ser1)<- get_order (burial_ser2)<- get_order (burial_ser3)# Suggested orderings rbind (ord1, ord2, ord3)
     AN13-Jowell-Pur CE12-Allen-18Bur CE6-Hackney-2Bur AN26-Patton-Pur
ord1               4                3                2               5
ord2               1                5                2               3
ord3               1                5                2               3
     AN21-E-Owens-1Bur
ord1                 1
ord2                 4
ord3                 4
<- c ("AR_events" , "AR_deviations" , "Gradient_raw" , "Gradient_weighted" )<- permute (burial_dist, ord1)<- permute (burial_dist, ord2)<- permute (burial_dist, ord3)<- permute (burial_dist, dec_ord)<- permute (burial_dist, ca_ord)# Comparison between original and ordered: <- list (Original= burial_dist, Ordered1= burial_ord1, Ordered2= burial_ord2, Ordered3= burial_ord3, CA= gahagan_ca_ord, DEC= gahagan_dec_ord)round (sapply (Results, criterion, method= Crit), 1 )
                  Original Ordered1 Ordered2 Ordered3     CA   DEC
AR_events              8.0      3.0      3.0      3.0   10.0   9.0
AR_deviations        152.4     12.2     12.2     12.2  333.2 267.9
Gradient_raw           4.0     14.0     14.0     14.0    0.0   2.0
Gradient_weighted    135.3    534.1    534.1    534.1 -162.7   6.7
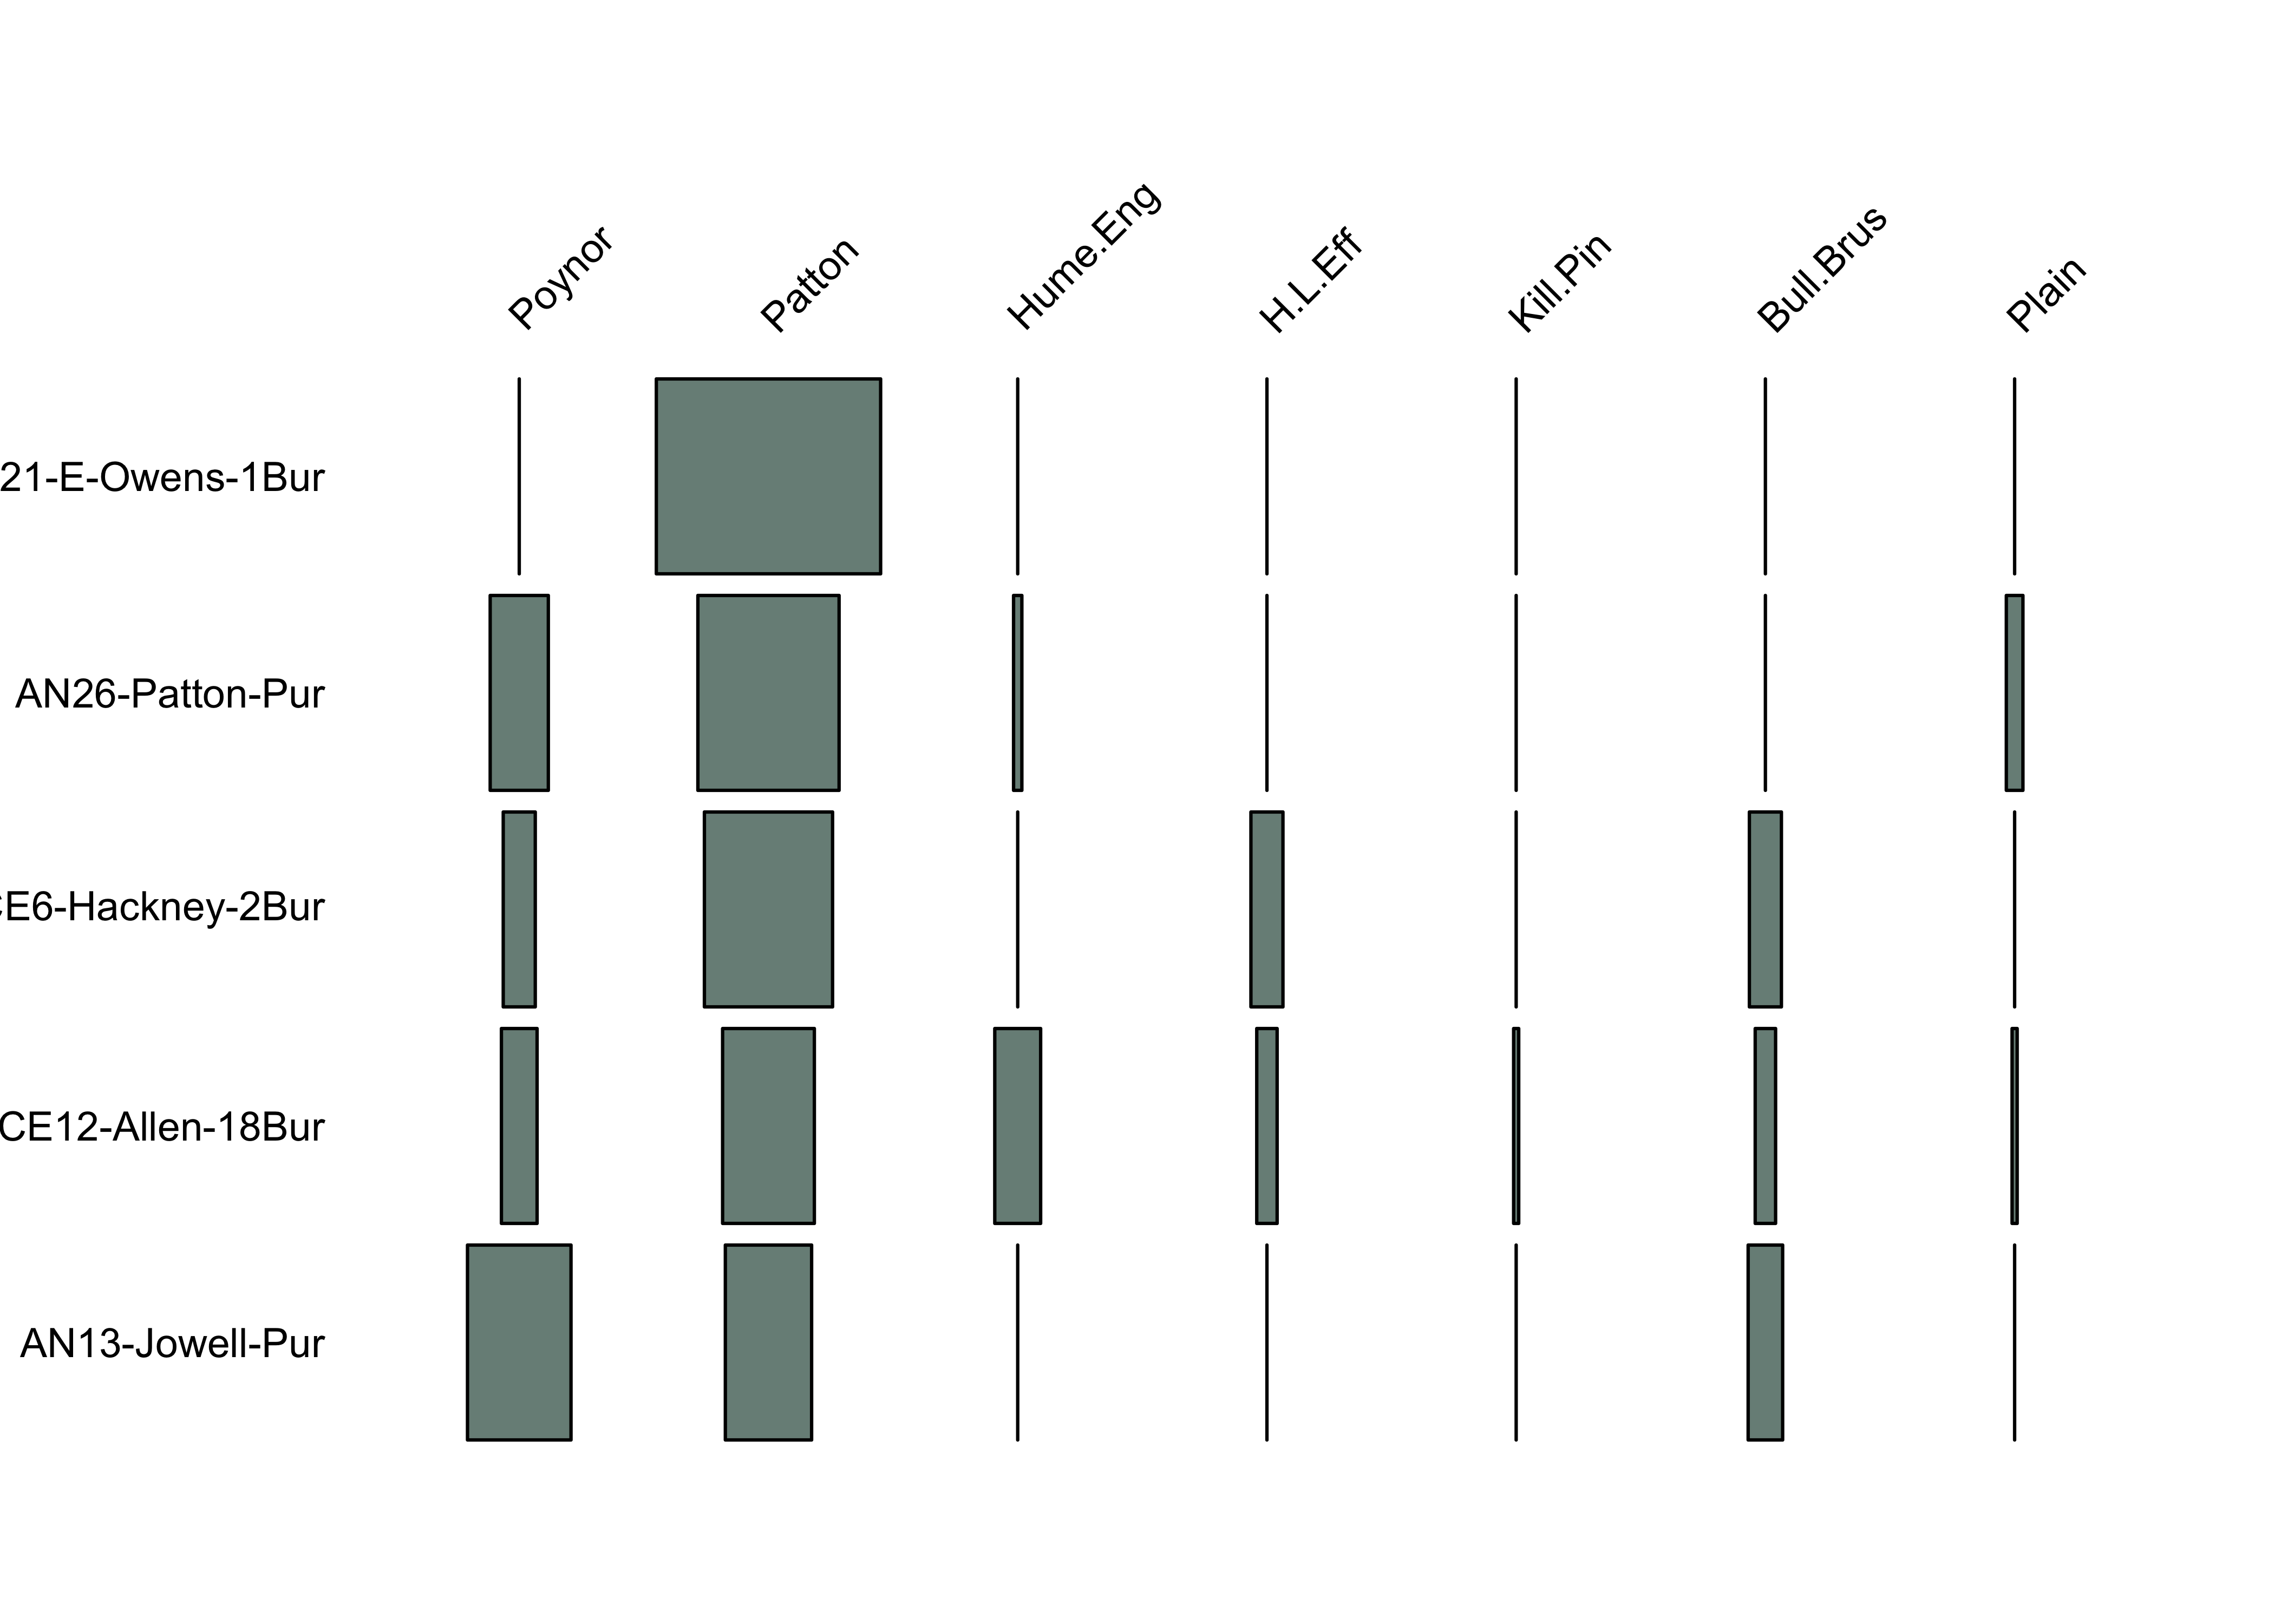
battleship.plot (burial_pct[ord2, ], col= "#798E87" , cex.labels = .75 )


